Tag: General (Water, Hydrology & Resources)

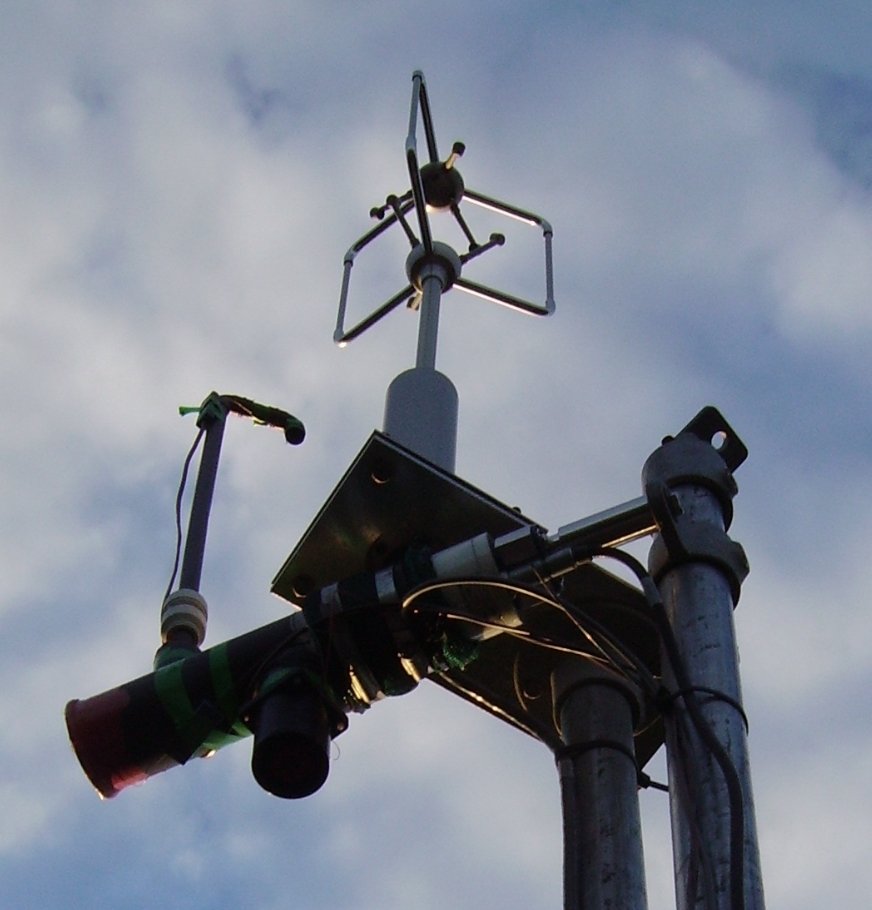
  • Global eddy covariance towers cluster in fertile soils

    Global eddy covariance towers cluster in fertile soils

    What the study found

    The study found that the global eddy covariance tower network is unevenly distributed across space and soil conditions. Among 1,233 towers, half had a nearest neighbor within 10 km, and tower locations were associated with soil pixels that were more fertile than the global average.

    Why the authors say this matters

    The authors conclude that global syntheses of eddy covariance tower data should take into account that the network captures more fertile soils than the terrestrial surface on average. They also suggest that improving global representativeness will require collaborations and investment in underrepresented regions.

    What the researchers tested

    The researchers examined 1,233 global eddy covariance towers and compared their spatial spacing and surrounding soil characteristics with global soil database pixels. They looked at nearest-neighbor distances between towers and compared tower-associated soil texture and chemistry with pixels without towers.

    What worked and what didn't

    Tower-associated soil pixels had nearly 20% more silt and 8% less sand than the global soil texture distribution. They also had more soil nitrogen (0.58 g/kg vs. 0.38 g/kg), more organic carbon (8.3 g/kg vs. 5.4 g/kg), and 10% greater cation exchange capacity in upper layers than pixels without towers.

    What to keep in mind

    The abstract does not describe specific study limitations beyond noting gaps in network representativeness. The findings are based on the towers and soil data examined here, so the summary does not provide details about causes or effects beyond those comparisons.

    • The study examined 1,233 global eddy covariance towers.
    • Half of the towers had a nearest neighbor within 10 km.
    • Tower locations were linked to soils with more silt, less sand, more nitrogen, and more organic carbon than average.
    • Upper soil layers at tower pixels had 10% greater cation exchange capacity than pixels without towers.
    • The authors say global tower syntheses should account for the network’s bias toward more fertile soils.
  • Land humidity trends differ across observations, reanalyses, and models

    What the study found

    The study found that a simple index based on the ratio of precipitation to a modified potential evapotranspiration can capture land relative humidity, or RH, variability and its different historical trends in observations, reanalyses, and Earth system models. It also found that land RH has decreased substantially from 1973 to 2024.

    Why the authors say this matters

    The authors say the index provides a physical calibration for biased land RH in reanalyses and a quantitative framework for interpreting land RH changes. They conclude that the findings indicate a drier land future than current projections.

    What the researchers tested

    The researchers developed and tested an index based on precipitation and a modified potential evapotranspiration, which is an estimate of atmospheric demand for water from land surface processes and is formulated independently of RH. They compared this index with observed land RH, reanalyses, and Earth system model output over 1973 to 2024.

    What worked and what didn't

    The index captured the spatiotemporal variability of land RH and the distinct historical trends seen in observations, reanalyses, and models. It also captured the coherent bias in reanalyses and could be calibrated using observed precipitation and temperature. Models showed a wide range of land RH trends, but nearly all runs underrepresented the historical drying, with weaker model drying linked mainly to weaker subtropical precipitation declines.

    What to keep in mind

    The abstract notes limited observations, biased reanalyses, and the lack of a framework as background problems, but it does not give detailed study limitations beyond this context. The authors also say the model-observation discrepancy is unlikely to be explained by internal variability.

    • A precipitation-to-modified-potential-evapotranspiration index captured land RH variability and trends.
    • Land RH decreased substantially from 1973 to 2024.
    • Reanalyses overestimated the observed RH decrease and were linked to exaggerated warming and precipitation decline.
    • Models showed a wide spread, but nearly all underrepresented historical land drying.
    • Weaker drying in models was mainly tied to weaker subtropical precipitation declines.
  • China forestation is linked to hydrologic trade-offs

    What the study found

    The review concludes that China’s large-scale forestation has changed water-related processes in multiple ways. The authors report increases in evapotranspiration, increases in carbon sequestration, declines in total water yield, and significant reductions in soil erosion, along with trade-offs among ecosystem services.

    Why the authors say this matters

    The authors say China’s forest-based ecological engineering programs offer a unique opportunity to study forest-water interactions at large scale. They conclude that long-term watershed-scale studies are needed to better characterize forest hydrologic processes across China and that continued monitoring is critical for sustaining ecological restoration programs under a changing environment.

    What the researchers tested

    This is a review article that synthesizes advances in forest hydrological studies in China. The authors reviewed current monitoring networks, research tools, and key ecohydrological processes influenced by national forestation, in the context of forest cover recovery, hydrologic change, and shifts in land management policy.

    What worked and what didn't

    The review reports that forestation has been associated with greater evapotranspiration and carbon sequestration and with lower total water yield. It also reports substantial reductions in soil erosion. The paper says there are still critical research gaps in understanding hydrologic responses to land management policy shifts from international perspectives.

    What to keep in mind

    This is a synthesis, not a new experiment, so the summary reflects the studies reviewed rather than one direct field test. The abstract does not give details on specific datasets, study sites, or limitations beyond the need for more long-term watershed-scale research.

    • The review links China’s forestation programs with changes in water and carbon-related processes.
    • Evapotranspiration and carbon sequestration increased, while total water yield declined.
    • Soil erosion was significantly reduced in the studies discussed.
    • The authors identify trade-offs among ecosystem services.
    • The paper calls for more long-term watershed-scale monitoring and study.
  • Cropland affects tropical Africa’s land surface temperature differently by day and night

    What the study found

    Croplands and nearby grasslands in tropical Africa show different land surface temperature patterns across the day. Croplands cool the surface at night, while daytime effects depend on how arid the region is.

    Why the authors say this matters

    The authors conclude that the findings provide a mechanistic understanding of how cropland expansion alters local climate across hydroclimatic gradients. They also highlight a potential risk of intensified daytime warming in less arid regions associated with cropland expansion.

    What the researchers tested

    The researchers quantified diurnal cycles of land surface temperature differences between croplands and nearby grasslands across tropical Africa. They used 17 years of geostationary satellite observations and a space-for-time substitution approach, and they examined biophysical mechanisms including turbulent heat fluxes, leaf area index, and surface albedo.

    What worked and what didn't

    Croplands consistently cooled the surface at night relative to surrounding grasslands. During daytime, temperature differences were negative in more arid regions and positive in less arid regions; analyses suggested that cropland-induced changes in turbulent heat fluxes were the main explanatory factor, mainly through differences in leaf area index. In less arid regions during the day, reduced turbulent heat fluxes were linked to surface warming, while in all other cases enhanced turbulent heat fluxes were linked to surface cooling.

    What to keep in mind

    The abstract does not describe specific limitations beyond the study scope. The findings are based on tropical Africa, croplands compared with nearby grasslands, and the variables and methods stated in the abstract.

    • Croplands consistently cooled the surface at night relative to nearby grasslands.
    • Daytime temperature effects depended on hydroclimatic conditions, especially aridity.
    • Daytime cropland effects were negative in more arid regions and positive in less arid regions.
    • Turbulent heat flux changes were identified as the main explanatory component of the temperature differences.
    • Differences in leaf area index were described as the primary driver of those flux changes.
  • Flower and leaf traits vary along a shared continuum

    What the study found

    The study found that flower traits are functionally linked to leaf traits through shared water- and size-related characteristics. Across the species sampled, flower phenotypes ranged from large flowers with thick petals and longer water turnover times to small flowers with thin petaloid structures and high residual conductance, meaning water loss after stomata close.

    Why the authors say this matters

    The authors conclude that this cross-organ correlation means habitat filtering based on the ecophysiological strategies of one organ would also influence the phenotypes of the other organ. The study suggests that understanding flower traits alongside leaf traits is important for interpreting plant water-use strategies.

    What the researchers tested

    The researchers carried out a comparative analysis of flowers and leaves in 245 plant species sampled at four locations spanning more than 100 degrees of latitude: Arctic tundra, tropical campos rupestres, Patagonian steppe, and a botanical garden in California. They examined seven homologous traits related to carbon and water economics using correlation analysis, standard major axes, principal component analysis, and trait networks.

    What worked and what didn't

    Positive scaling was found between flower and leaf traits such as residual conductance, water turnover time, petal and leaf thickness, and area. Network analysis showed no modular structure of flower and leaf traits when all species were evaluated together. The abstract does not report any trait relationships that clearly did not align with these patterns beyond the lack of modular structure.

    What to keep in mind

    The summary provided here is limited to the abstract, so detailed limits or caveats are not described. The study reports associations among traits, not direct experimental tests of causation.

    • Flowers and leaves showed linked trait patterns related to water and size.
    • Flower forms ranged from large, thick-petaled flowers to small flowers with thin petaloid structures.
    • Residual conductance, water turnover time, thickness, and area showed positive scaling between flower and leaf traits.
    • Trait networks showed no modular structure when all species were analyzed together.
    • The authors say habitat filtering affecting one organ could also affect the other.