Tag: Astrophysics & Stellar Science

  • LMC infall is linked to Milky Way halo reflex motion

    What the study found

    The study found a measurable reflex motion in the Milky Way’s outer halo stars that is associated with the Large Magellanic Cloud’s infall. Using this motion, the authors estimated the speed of the Milky Way’s lurch toward the Large Magellanic Cloud and the Large Magellanic Cloud mass enclosed within 50 kiloparsecs.

    Why the authors say this matters

    The authors conclude that their inference framework can provide rapid constraints for future surveys that measure the velocities of outer halo stars. They also suggest that their mass estimate implies the Large Magellanic Cloud’s total mass is at least about 10–15% of the Milky Way’s.

    What the researchers tested

    The researchers used a simulation-based inference framework, which uses simulations and neural networks to estimate parameter distributions. They analyzed mean radial and tangential velocities of outer Milky Way halo stars in distance and on-sky bins, and trained neural networks on 128,000 rigid Milky Way–Large Magellanic Cloud simulations conditioned on velocity data from DESI and from the combined H3+SEGUE+MagE outer halo surveys.

    What worked and what didn't

    Using the H3+SEGUE+MagE data set with on-sky quadrants, they reported a distance-averaged reflex motion velocity of 26.4^{+5.5}_{-4.4} km s^{-1} and an enclosed Large Magellanic Cloud mass within 50 kiloparsecs of 9.2^{+1.9}_{-2.3} × 10^{10} solar masses. The abstract says they constrained the reflex motion velocity and enclosed Large Magellanic Cloud mass using either the DESI or H3+SEGUE+MagE data set while varying survey sky coverage and depth, but it does not specify which configurations performed better beyond these reported estimates.

    What to keep in mind

    The quoted uncertainties are statistical. The abstract does not describe additional limitations beyond the scope of the surveys and simulations used, and it notes that the results come from a rigid Milky Way–Large Magellanic Cloud simulation framework.

    • The study links the Large Magellanic Cloud’s infall to a reflex motion in outer Milky Way halo stars.
    • The authors estimate a Milky Way travel speed toward the Large Magellanic Cloud of 26.4^{+5.5}_{-4.4} km s^{-1}.
    • They estimate the Large Magellanic Cloud mass within 50 kiloparsecs as 9.2^{+1.9}_{-2.3} × 10^{10} solar masses.
    • The authors suggest the Large Magellanic Cloud’s total mass is at least about 10–15% of the Milky Way’s.
    • Their framework was trained on 128,000 rigid Milky Way–Large Magellanic Cloud simulations and applied to DESI and H3+SEGUE+MagE data.
  • High mass ratios widen post-common-envelope separations somewhat

    What the study found

    The study found that higher companion-to-primary mass ratios can produce wider post-common-envelope separations in red giant binary interactions, but the widest separations they predicted were still smaller than the observed range. The authors also report that the inspiral becomes more stable around mass ratio q ≥ 1, and that fall-back material from the leftover bound envelope is a more likely source of circumbinary discs in their setup.

    Why the authors say this matters

    The authors are trying to explain post-red giant and post-asymptotic giant binary systems, which have longer periods and eccentric orbits than a standard common-envelope inspiral would leave. The study suggests that high mass ratio interactions and fall-back discs may help account for some of the observed features, although the abstract says their simulated separations remain too small.

    What the researchers tested

    The researchers carried out a series of three-dimensional hydrodynamical common-envelope binary interaction simulations using the smoothed particle hydrodynamics code Phantom. They modeled a 0.88 solar-mass, 90-solar-radius red giant branch star with companions spanning mass ratios q = M2/M1 from 0.68 to 1.5.

    What worked and what didn't

    Larger q values led to wider post-common-envelope separations, and the pre-common-envelope mass transfer phase lasted longer for more massive companions. Around q ≥ 1, the inspiral became significantly more stable, as predicted by analytical theory, but the abstract says this phase was not converged with respect to simulation resolution. Even with more material flowing through the L2 and L3 Lagrange points, the authors conclude that fall-back of bound envelope material is more likely than L2/L3 flow to form circumbinary discs for their parameters.

    What to keep in mind

    The abstract says the maximum predicted separation was only about 50 solar radii, which is still below the observed range for the systems they discuss. It also notes that the stability of the pre-inspiral phase was not converged with simulation resolution, so higher-resolution simulations are expected to give even more stability and a longer pre-inspiral phase. The available summary does not describe other limitations.

    • Higher companion-to-primary mass ratios produced wider post-common-envelope separations.
    • The widest predicted separation was still only about 50 solar radii, below the observed range.
    • The inspiral became more stable around mass ratio q ≥ 1.
    • The pre-common-envelope mass transfer phase lasted longer for more massive companions.
    • The authors conclude that circumbinary discs are more likely to form from fall-back of bound envelope material than from L2/L3 outflow.
  • GW170817 analysis gives tighter constraints on viewing angle and H0

    What the study found

    The study found that reanalyzing GW170817, a binary neutron star merger, produced tighter constraints on the jet viewing geometry and on Hubble’s constant (H0, the cosmic expansion rate). Using a fixed cosmology, the authors report a viewing angle of 18.3°–20.3°; when fitting distance and H0 directly, they report 16.8°–19.2°, D_L = 44.0 ± 1.6 Mpc, and H0 = 65.5 ± 4.4 km s−1 Mpc−1.

    Why the authors say this matters

    The authors say this matters because the accuracy of the standard siren measurement of H0 from GW170817 depends strongly on how well the merger inclination angle is constrained. They also note that their H0 result is close to the early-Universe Planck value and less close to the late-Universe SH0ES measurement, in the context of the current Hubble constant discrepancy.

    What the researchers tested

    The researchers tested a Bayesian visibility-plane model-fitting framework that included all relevant very long baseline interferometry (VLBI; high-resolution radio interferometry) data, handled systematic uncertainties, and sampled the model parameter space rigorously. They fit new hydrodynamical afterglow models with a continuum of jet geometries, and then extended the framework to fit for luminosity distance and H0 directly while marginalizing over plausible peculiar velocity corrections.

    What worked and what didn't

    Including all relevant VLBI data and systematic uncertainties allowed the authors to obtain more informed and robust measurements of the viewing geometry and H0. The fit with a fixed cosmology gave a viewing-angle range of 18.3°–20.3°, and the direct fit gave 16.8°–19.2° with D_L = 44.0 ± 1.6 Mpc and H0 = 65.5 ± 4.4 km s−1 Mpc−1. The abstract does not report any failed test case or comparison showing a method that did not work.

    What to keep in mind

    The abstract notes potential caveats, but it does not list them in detail. The reported H0 result depends on the modeling choices, the included VLBI data, and the treatment of peculiar velocity corrections, and the fixed-cosmology viewing-angle estimate uses D_L = 40.7 Mpc as in most previous analyses.

    • GW170817 was reanalyzed to constrain jet geometry and H0 more precisely.
    • The authors used a Bayesian visibility-plane model with VLBI data and systematic uncertainties.
    • With fixed cosmology, they report a viewing angle of 18.3°–20.3°.
    • With distance and H0 fitted directly, they report D_L = 44.0 ± 1.6 Mpc and H0 = 65.5 ± 4.4 km s−1 Mpc−1.
    • The peak H0 value is within 0.5 sigma of Planck and 1.7 sigma from SH0ES, according to the abstract.
  • Kilonova-like bursts may also fit a collapsar model

    What the study found

    The authors report that the kilonova-like emission seen after GRB 211211A and GRB 230307A is not limited to a neutron star merger explanation. They say these observations are also consistent with nucleosynthesis, the creation of new atomic nuclei, in a collapsar scenario.

    Why the authors say this matters

    The authors conclude that their findings challenge the idea that a red evolution in these transients necessarily means heavy r-process elements, meaning elements made by rapid neutron capture. They suggest the data can be explained without requiring lanthanide-rich material, a class of heavy elements often linked to red emission.

    What the researchers tested

    The researchers compared the observations of GRB 211211A and GRB 230307A with a collapsar-based model. They tested whether a single, weak r-process component could reproduce the observed optical and infrared light curves, which are the changes in brightness measured in visible and infrared light.

    What worked and what didn't

    The model was able to reproduce the observed optical and infrared light curves using a single, weak r-process component. The abstract says the model is consistent with the data and does not require lanthanide-rich material.

    What to keep in mind

    The summary available here is limited to the abstract, so only the authors' stated comparison and conclusions can be reported. The abstract does not describe additional limitations, tests, or alternative analyses beyond the collapsar interpretation.

    • The authors say kilonova-like emission after two long-duration gamma-ray bursts can fit a collapsar scenario.
    • They report that a single, weak r-process component reproduced the observed optical and infrared light curves.
    • The model did not require lanthanide-rich material, according to the abstract.
    • The findings challenge the idea that red evolution in these transients necessarily signals heavy r-process elements.
  • Euclid Q1 catalogue covers 378,000 galaxies

    Euclid Q1 catalogue covers 378,000 galaxies

    What the study found

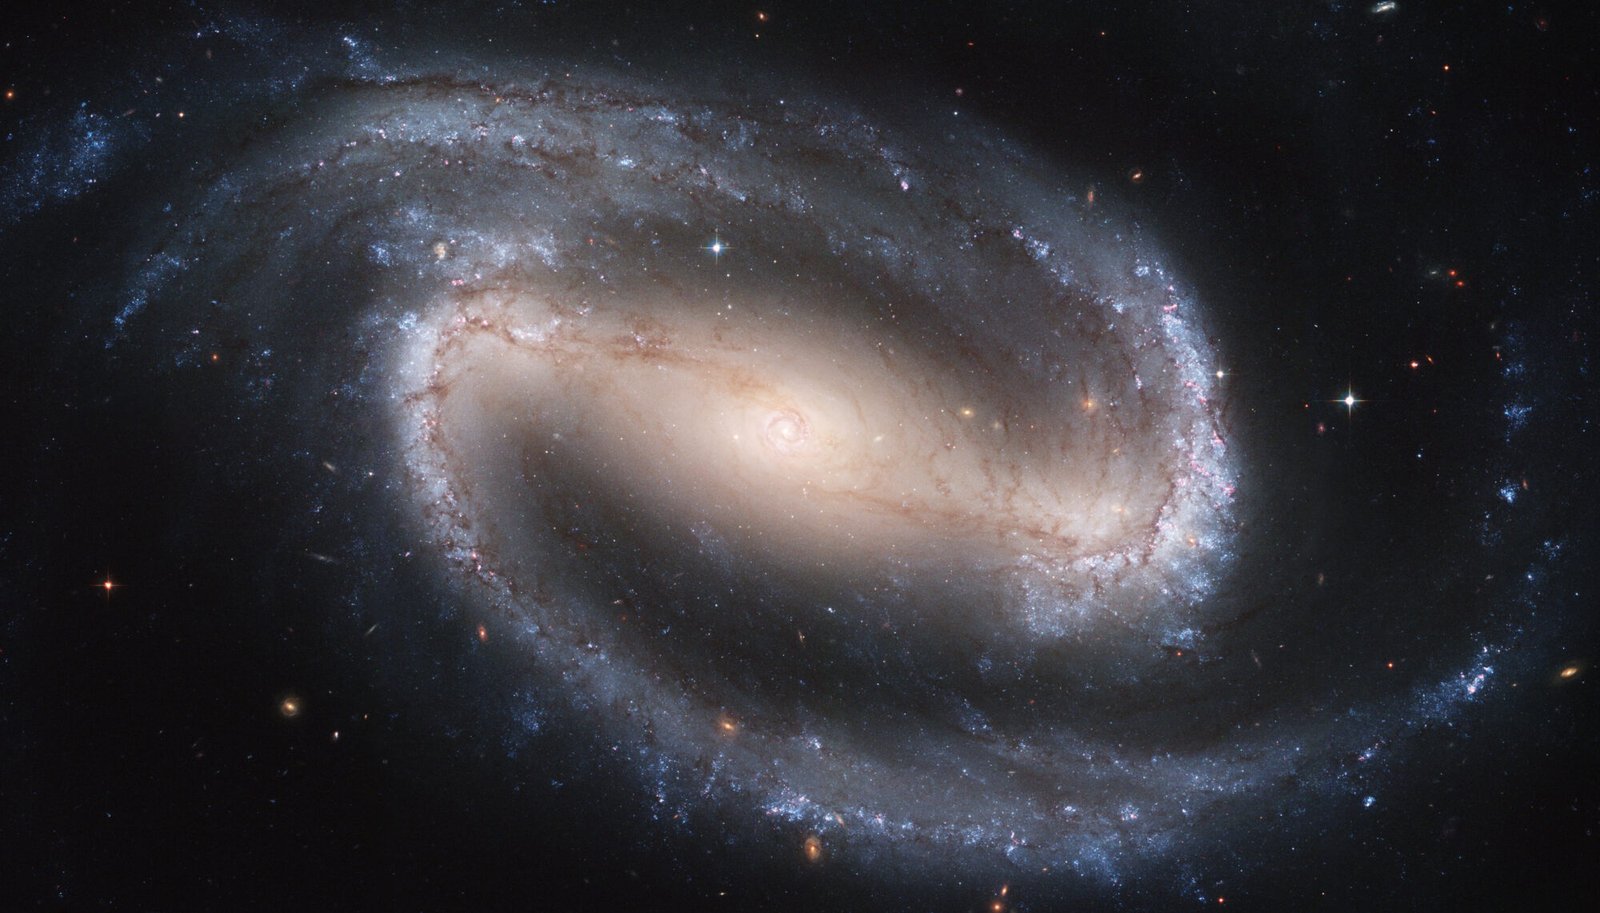
    The study reports a detailed visual morphology catalogue for Euclid Quick Release 1, covering 378,000 bright or extended galaxies. The catalogue includes features such as bars, spiral arms, and ongoing mergers.

    Why the authors say this matters

    The authors say the measurements are fully automated and therefore fully scalable. They also note that this catalogue is the first 0.4% of the roughly 100 million galaxies in which Euclid will ultimately resolve detailed morphology.

    What the researchers tested

    The researchers created the catalogue by fine-tuning the Zoobot galaxy foundation models on annotations from a one-month campaign by Galaxy Zoo volunteers. They applied this approach to Euclid Quick Release 1 galaxy images.

    What worked and what didn't

    The abstract states that the catalogue was successfully produced and that the measurements are fully automated. It does not describe failures, comparisons, or performance limits.

    What to keep in mind

    The summary available here does not describe detailed validation, uncertainty, or limitations beyond the scope of the catalogue. It also covers only the Euclid Quick Release 1 sample described in the abstract.

    • A detailed visual morphology catalogue was produced for Euclid Quick Release 1.
    • The catalogue covers 378,000 bright or extended galaxies.
    • Galaxy features included bars, spiral arms, and ongoing mergers.
    • The catalogue was made by fine-tuning Zoobot models on Galaxy Zoo volunteer annotations.
    • The authors describe the measurements as fully automated and scalable.
  • Kerr-de Sitter black holes show stronger repetitive Penrose energy performance

    What the study found

    The study found that repetitive Penrose process behavior in Kerr-de Sitter black holes differs from that in Kerr black holes in several ways. In particular, Kerr-de Sitter black holes can show higher energy return on investment and higher single-extraction energy capability, and these outcomes vary with the cosmological parameter and decay radius.

    Why the authors say this matters

    The authors say the work extends earlier findings on repetitive Penrose processes in black holes to the Kerr-de Sitter case. The study suggests that the cosmological parameter influences how much energy can be extracted and how efficiently the process works.

    What the researchers tested

    The researchers studied the repetitive Penrose process in Kerr-de Sitter black holes and examined how the cosmological parameter affects it. They compared the results with Kerr black holes and looked at energy return on investment, single-extraction energy capability, energy utilization efficiency, and extracted energy across different decay radii.

    What worked and what didn't

    The results show that Kerr-de Sitter black holes have higher energy return on investment and higher single-extraction energy capability than Kerr black holes. The larger the cosmological parameter, the stronger these two measures became. At lower decay radius, Kerr black holes had higher energy utilization efficiency and more extracted energy after the repetitive Penrose process finished, but at higher decay radius the Kerr-de Sitter black hole showed higher values because of the stopping condition of the iteration.

    What to keep in mind

    The abstract does not describe experimental limitations or observational data. The comparison is limited to the repetitive Penrose process, Kerr and Kerr-de Sitter black holes, and the variables named in the abstract.

    • Kerr-de Sitter black holes can have higher energy return on investment than Kerr black holes in the repetitive Penrose process.
    • A larger cosmological parameter strengthens the energy return on investment and single-extraction energy capability.
    • At lower decay radius, Kerr black holes show higher energy utilization efficiency and more extracted energy after completion.
    • At higher decay radius, Kerr-de Sitter black holes show higher energy utilization efficiency and more extracted energy.
    • The differences are linked in the abstract to the stopping condition of the iteration.
  • NuSTAR finds MAXI J1752–457 in an accretion-powered state after a superburst

    What the study found

    The study found that MAXI J1752–457, an X-ray transient, was confirmed by NuSTAR to be the same source as EP240809a and was observed after a superburst. The source’s hard X-ray spectrum was consistent with a spherical blackbody component and a steep, nonthermal power-law component.

    Why the authors say this matters

    The authors conclude that the source appears to have entered an accretion-powered flux state, meaning its emission was likely being powered by material falling onto the neutron star. They also suggest that the steep power-law spectrum may reflect ongoing evolution of the electron energy distribution several days after the superburst.

    What the researchers tested

    The researchers analyzed two NuSTAR observations taken after a superburst detected by MAXI/Gas Slit Camera in 2024 November. They carried out spectral analysis of both observations and an energy-resolved timing analysis; NuSTAR is a NASA X-ray telescope that observes high-energy light.

    What worked and what didn't

    At about 79 hours after the superburst began, they measured a blackbody temperature of kT bb = 0.60 ± 0.1 keV and a blackbody radius of R bb / D 8 = 6.0 −0.3 +0.4 km, without corrections for scattering in the neutron star atmosphere. The blackbody temperature did not change significantly over the 1-day interval between the two observations, variability was dominated by red noise in the power-law component, and the photon index was about Γ ≈ 4, which is much steeper than typically observed at similar luminosities.

    What to keep in mind

    The distance to the source is not yet known, so the radius is expressed relative to distance in units of 8 kpc. The authors note that the lack of hard X-ray observations before and during the superburst makes it difficult to give a conclusive physical interpretation of the steep power-law result.

    • NuSTAR confirmed that MAXI J1752–457 matches the earlier source EP240809a.
    • The spectrum fit a spherical blackbody plus a steep nonthermal power-law component.
    • The blackbody temperature stayed roughly unchanged between the two NuSTAR observations.
    • Timing analysis showed red-noise variability dominated the power-law component.
    • The authors infer the source had entered an accretion-powered flux state.
    • A steep photon index of about 4 was measured, but its physical meaning is uncertain.
  • Study identifies source classes for black hole shadow imaging

    What the study found

    The study identifies three general classes of nearby supermassive black holes for shadow imaging: sources that become transparent at traditional imaging frequencies, sources that need higher frequencies, and sources that are unlikely to become transparent down to the black hole shadow in the submillimeter band. The authors also find that the critical frequency for transparency depends on black hole and accretion-flow parameters.

    Why the authors say this matters

    The authors say the results will help with target selection and wavelength optimization for future very-long-baseline interferometry, or VLBI, arrays. They note that both resolution and transparency are needed to resolve black hole shadows.

    What the researchers tested

    The researchers modeled accretion flows around a broad population of nearby supermassive black holes using a covariant semi-analytic flow model and general-relativistic radiative transfer. They examined how black hole and accretion-flow parameters affect spectra, image morphology, and the frequency at which the flows become optically thin, meaning transparent to the radiation being studied.

    What worked and what didn't

    Their modeling showed that some sources should be transparent at frequencies already used for imaging, while others would require higher observing frequencies. The study also found a group of sources that are unlikely to be transparent enough to reveal the shadow in the submillimeter band.

    What to keep in mind

    The abstract does not describe specific source names, sample size, or observational tests of the model. It also does not provide detailed limitations beyond the need to consider both angular resolution and transparency for future imaging.

    • The study groups nearby supermassive black holes into three classes for shadow imaging based on transparency frequency.
    • Some sources may be imaged at traditional frequencies, while others need higher frequencies.
    • Some black holes are unlikely to become transparent enough in the submillimeter band to show the shadow.
    • Black hole and accretion-flow parameters affect spectra, image shape, and the critical transparency frequency.
    • The authors say the results can guide target selection and wavelength choice for future VLBI arrays.
  • Pancake shapes in 2D cosmologies are highly anisotropic

    What the study found

    The study found that, in the model examined, pancakes in two-dimensional cold dark matter cosmologies are dominantly C-shaped, and that many of them evolve into filaments. It also found that pancakes are more strongly curved when they evolve into halos, and that the shell crossing is highly anisotropic.

    Why the authors say this matters

    The authors suggest that the cosmic web can be characterized using singularities, which are the points where particle trajectories first cross. They also conclude that extending this work to three dimensions could allow tests against observations of the cosmic web and searches for signatures of non-Gaussianity, meaning departures from Gaussian, or bell-curve-like, statistics.

    What the researchers tested

    The researchers used catastrophe theory in two dimensions to study motion around singularities and to analytically model the shape of emerging structures, especially pancakes. They computed higher-order corrections to pancake shape, including curvature and the transition scale from C to S, and used Gaussian statistics under a Zeldovich flow assumption for the model parameters.

    What worked and what didn't

    Their model produced distributions of observable pancake-shape features and their variation across halo and filament populations in two-dimensional cosmologies. The reported results were that a larger fraction of pancakes evolves into filaments, pancakes are more curved when they evolve into halos, and the shell crossing is highly anisotropic.

    What to keep in mind

    The abstract describes a two-dimensional theoretical study, so the results are limited to that setting. It also notes that an extension to three dimensions would be needed to compare predictions with actual cosmic-web observations.

    • Pancakes in the 2D model are mostly C-shaped.
    • More pancakes evolve into filaments than into other structures.
    • Pancakes that become halos are more strongly curved.
    • Shell crossing is described as highly anisotropic.
    • The study uses catastrophe theory and Gaussian statistics with a Zeldovich flow assumption.
  • Cluster stellar mass grows from z 0.8 to 0.2

    What the study found

    The study found that the characteristic stellar mass, a measure of the typical mass scale in the cluster stellar mass function, changed only slightly from redshift 0.55 to 0.8, with most measurable growth occurring from redshift 0.2 to 0.55. It also found evidence that the cluster stellar mass fraction in galaxies above 10^9.5 solar masses increased by a factor of 2.5 after accounting for cluster halo mass growth.

    Why the authors say this matters

    The authors suggest this means most massive galaxies in clusters were already in place by redshift 0.8, and that later changes were driven by late-time assembly processes. They also conclude that the evolution of the cluster stellar mass fraction shows significant growth over this period.

    What the researchers tested

    The researchers studied 568 Sunyaev–Zel'dovich-selected galaxy clusters, which are clusters identified through their effect on the cosmic microwave background, with masses above 2.9 × 10^14 solar masses and redshifts between 0.2 and 0.8. Using deep photometry, meaning measurements of object brightness in multiple bands of light, from DECaLS DR10, they built redshift- and cluster-mass-binned composite cluster stellar mass functions down to 10^9.5 solar masses.

    What worked and what didn't

    The analysis produced the first cluster stellar mass function study for this sample at this epoch. The characteristic stellar mass evolved only marginally at redshifts 0.55 to 0.8, while the low-mass slope was flat at high redshift and steepened below redshift 0.55, suggesting more massive galaxies in high-redshift clusters than in low-redshift clusters.

    What to keep in mind

    The abstract does not describe detailed limitations beyond the redshift and mass range studied. The findings are restricted to this cluster sample, this epoch, and galaxies above 10^9.5 solar masses.

    • The study examined 568 galaxy clusters selected by the Sunyaev–Zel'dovich effect.
    • Most measurable stellar-mass growth occurred between redshift 0.2 and 0.55.
    • The characteristic stellar mass changed only slightly from redshift 0.55 to 0.8.
    • The low-mass slope was flat at high redshift and steeper below redshift 0.55.
    • Cluster stellar mass fractions in galaxies above 10^9.5 solar masses grew by a factor of 2.5 after halo-mass growth was accounted for.