
Tag: Hydrology & Watersheds

  • Stochastic particle method improves terrain erosion simulation

    Stochastic particle method improves terrain erosion simulation

    What the study found

    The study found that a novel parallel, stochastic particle-based method can simulate transport over geological timescales. The authors say it also supports a new erosion model based on a more general form of momentum conservation.

    Why the authors say this matters

    The authors suggest this matters because erosion modeling has to handle transport and erosion processes that occur on very different timescales. They also state that their approach relaxes strong velocity assumptions used in prior work, including approaches based on the Stream Power Law, a rule used in some erosion models.

    What the researchers tested

    The researchers developed and evaluated a parallel, stochastic particle-based method for erosion simulation. They tested whether it could accurately solve the underlying conservation laws and whether the resulting erosion model could represent terrain evolution over geological timescales.

    What worked and what didn't

    The abstract says the scheme accurately solves the underlying conservation laws and avoids artifacts common in previous work. It also says the new erosion model captures multiscale geomorphological features, including coherent basin structures and dynamic phenomena such as braided rivers, meanders, and deltas.

    What to keep in mind

    The abstract does not describe detailed limitations, comparison settings, or quantitative performance measures. It also does not provide information about real-world validation beyond the reported simulation results.

    • The study presents a novel parallel, stochastic particle-based method for erosion simulation.
    • The authors say the approach can simulate transport over geological timescales.
    • The method relaxes strong velocity assumptions used in prior erosion models, including those based on the Stream Power Law.
    • The abstract says the scheme solves the underlying conservation laws accurately and avoids common artifacts.
    • The new erosion model is reported to capture coherent basin structures, braided rivers, meanders, and deltas.
  • Data augmentation improved some river-flow models in scarce-data catchments

    What the study found

    The study found that data augmentation can improve machine learning (ML) models for simulating river flows in data-scarce catchments, especially when training data are limited. It also found that the usefulness of these approaches depends on how much data are available.

    Why the authors say this matters

    The authors conclude that the findings offer practical guidance for water resource engineers and modellers on when model-specific and data-dependent data augmentation strategies may be useful for river flow modelling in data-scarce regions. The study suggests this is relevant for sustainable water resources management under a changing climate.

    What the researchers tested

    The researchers evaluated statistical bootstrapping and physics-based data augmentation in two data-scarce Sub-Saharan African catchments with contrasting climates. They applied these methods to a Feed Forward Neural Network (FFNN) and a Long Short-Term Memory (LSTM) model, and compared their performance with the physically based Hydrologic Engineering Center Hydrologic Modeling System (HEC-HMS).

    What worked and what didn't

    Comparisons of standalone ML models with HEC-HMS showed data-dependent performance: HEC-HMS performed better than ML models on very limited datasets, while ML models performed better as data availability increased. Adding data augmentation improved FFNN and LSTM performance, particularly with limited training data. Limited or comparable performance was seen when longer training datasets were used, and the augmentation approaches appeared independent of model architecture and catchment hydroclimatic conditions.

    What to keep in mind

    The study was limited to two data-scarce catchments in Sub-Saharan Africa. The abstract does not describe additional limitations beyond the data dependence of the results and the mixed performance of augmentation with longer training datasets.

    • Bootstrapping and physics-based data augmentation improved FFNN and LSTM river-flow models when training data were limited.
    • HEC-HMS outperformed the machine learning models on very limited datasets.
    • Machine learning models performed better as more data became available.
    • With longer training datasets, augmentation showed limited or comparable performance.
    • The reported augmentation effects did not depend on model architecture or catchment hydroclimatic conditions.
  • GNN model identifies flood-vulnerable river segments

    What the study found

    The study found that a graph neural network (GNN, a machine-learning model that works with connected data) can be used to score river segments for flood vulnerability. In the case study, the two models gave similar high-risk areas and matched observed flood patterns reasonably well.

    Why the authors say this matters

    The authors conclude that the framework is a practical, data-efficient tool for identifying vulnerable river segments and flood-prone sub-basins. The study suggests it may support flood risk management and decision-making in complex river systems.

    What the researchers tested

    The researchers proposed a graph neural network-based framework in which each river segment was treated as a node with hydrological and geomorphological attributes. They used two GNN models to generate vulnerability scores by combining node attributes with network structure, then aggregated high-risk segments to delineate flood-sensitive sub-basins.

    What worked and what didn't

    In a case study of the Xijiang River system in Guangxi, China, the two models converged on similar high-risk areas. The overlap in identified high-risk segments was 60%, and the results aligned well with observed flood patterns.

    What to keep in mind

    The abstract describes one case study, so the available summary is limited to the Xijiang River system in Guangxi, China. It does not describe detailed limitations beyond noting that the method is intended for regions with complex river networks and limited hydrological data.

    • The study used graph neural networks to assess flood vulnerability in a river basin system.
    • River segments were modeled as nodes with hydrological and geomorphological attributes.
    • Two models produced similar high-risk areas, with 60% overlap in identified high-risk segments.
    • The results matched observed flood patterns in the Xijiang River case study.
    • The authors describe the framework as practical and data-efficient for flood risk management.
  • Projected land cover changes slightly increase flood discharge

    What the study found

    The study found that projected land cover change in the Cijangkelok Watershed is associated with a small rise in flood discharge. The authors report that the 2035 scenario shows land conversion mainly from dryland to rice fields, built-up areas, and forest plantations.

    Why the authors say this matters

    The findings indicate that land cover change contributes to higher flood potential. The authors conclude that the increase is still at a moderate level because much of the conversion is to rice fields, which they describe as temporary water storage that delays direct runoff.

    What the researchers tested

    The researchers analyzed land cover changes using Curve Number (a runoff-related parameter), Impervious area, and Initial Abstraction (the amount of rainfall absorbed before runoff begins). They used land cover data from 2009 and 2022, modeled a 2035 scenario with QGIS MOLUSCE using an artificial neural network (ANN), and ran HEC-HMS simulations with SCS and Snyder Unit Hydrograph methods.

    What worked and what didn't

    The 2035 land cover prediction had a minimum overall error of 0.0332 and a Kappa coefficient of 0.765, which the authors describe as good reliability. Composite Curve Number increased from 67.9 in 2009 to 68.0 in 2022 and 68.4 in 2035; Impervious area increased from 5.6 to 5.7 and 6.4; and Initial Abstraction decreased from 24.0 to 23.9 and 23.5. Flood discharge rose from 617.2 m³/s to 623.8 m³/s to 641.3 m³/s with the SCS method, and from 621.3 to 621.6 to 630.5 m³/s with the Snyder method. The statistical comparison with frequency-based design flood discharge gave PBIAS values of 0.1–0.2 and NSE of 1.0, which the abstract describes as very good.

    What to keep in mind

    The abstract provides no detailed discussion of study limitations beyond the model-based nature of the work. The reported flood increase is specific to the Cijangkelok Watershed and to the 2009, 2022, and 2035 land cover scenarios described in the study.

    • Projected 2035 land cover change is concentrated in conversions from dryland to rice fields, built-up areas, and forest plantations.
    • Composite Curve Number rose slightly across the study years, while Initial Abstraction decreased.
    • Simulated flood discharge increased under both the SCS and Snyder methods.
    • The 2035 land cover model had an overall error of 0.0332 and a Kappa coefficient of 0.765.
    • The authors state that the flood increase remains at a moderate level because rice fields can temporarily store water.
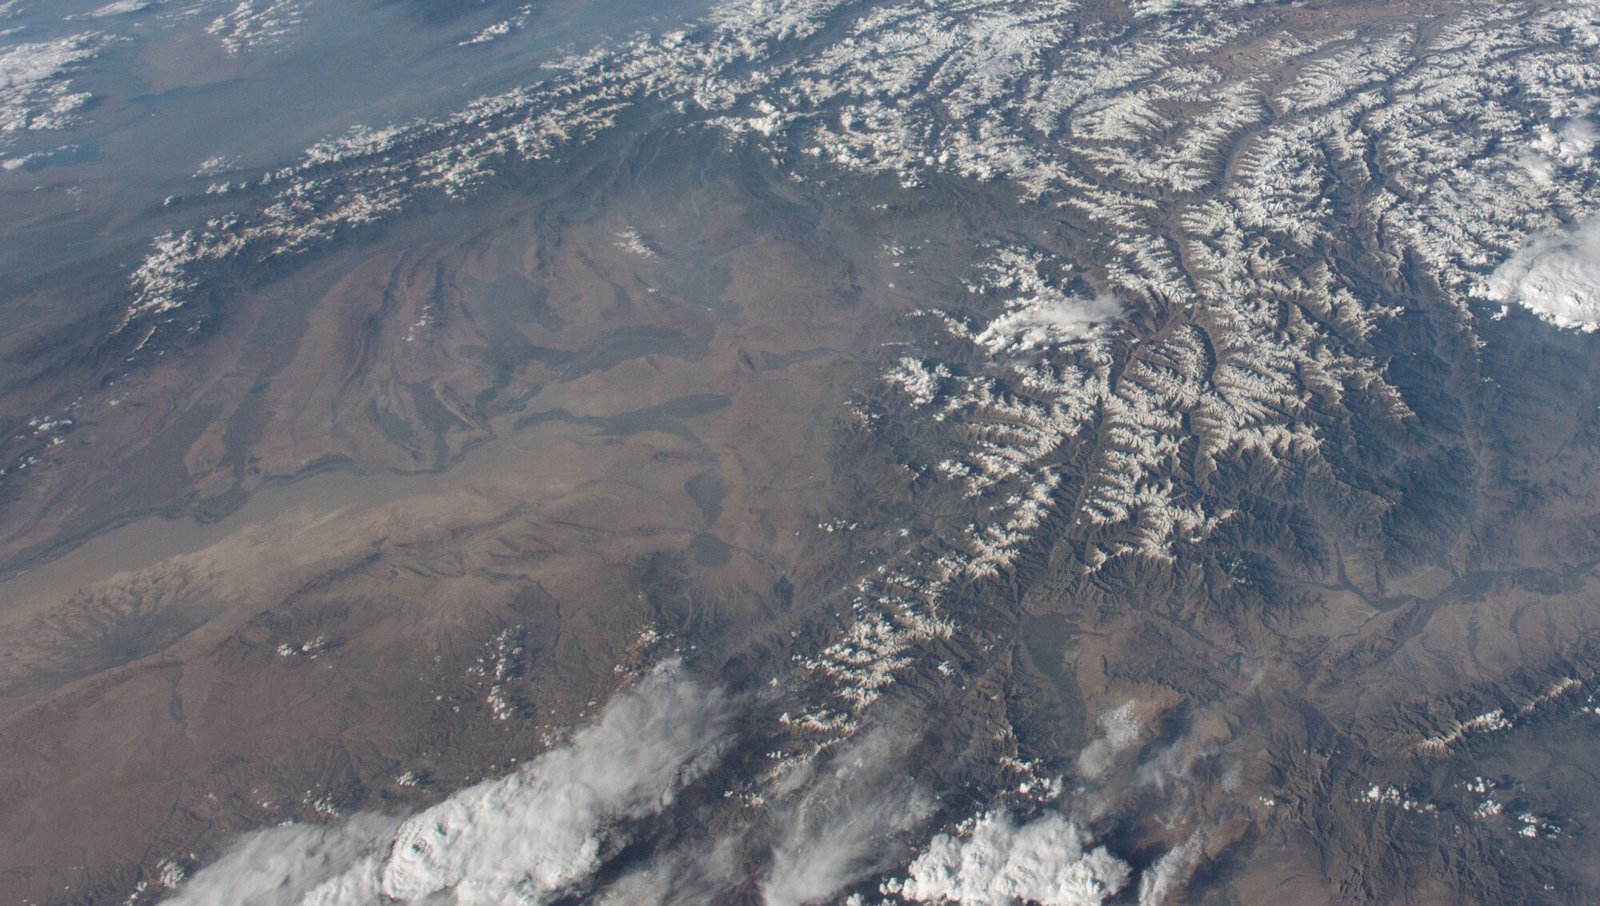
  • Flood susceptibility is projected to rise in the Kabul River Basin

    Flood susceptibility is projected to rise in the Kabul River Basin

    What the study found

    The study found a projected increase in flood susceptibility in the Kabul River Basin from 2020 to 2100. The share of areas classified as "Very Highly" susceptible rose overall, while the share classified as "Very Low" susceptible declined.

    Why the authors say this matters

    The authors conclude that dynamic environmental and demographic changes should be integrated into flood management strategies in the Kabul River Basin. They also say the study offers a transferable outline for flood assessment in climate-sensitive mountainous regions and provides actionable insights for land use planning and climate adaptation policy.

    What the researchers tested

    The researchers assessed projected flood susceptibility in the transboundary and ecologically sensitive Kabul River Basin under different future scenarios from 2020 to 2100. They used an eXtreme Gradient Boosting (XGBoost) machine learning model with three dynamic and nine static predictors, along with bootstrap uncertainty analysis.

    What worked and what didn't

    The XGBoost model showed strong predictive accuracy, with AUC values of 0.961 to 0.962, and high cross-temporal consistency across future scenarios, with correlations of 0.75 to 0.85. Bootstrap uncertainty analysis also supported the model's robustness, with mean AUCs of 0.9817 to 0.9834, very low standard errors, and narrow confidence intervals. The abstract identifies population growth as a key driver of future flood risk.

    What to keep in mind

    The summary does not describe specific limitations beyond noting limited prior understanding of how these factors interact in the region. The findings are projections for the Kabul River Basin and are based on the model and predictors used in this study.

    • Flood susceptibility in the Kabul River Basin is projected to increase from 2020 to 2100.
    • Areas labeled "Very Low" susceptibility are projected to decline from 66.17% in 2020 to 56.43% by 2100.
    • Areas labeled "Very Highly" susceptible rise from 11.78% in 2020 to 13.51% by 2100.
    • The XGBoost model showed strong accuracy, with AUC values of 0.961 to 0.962.
    • Bootstrap uncertainty analysis reported mean AUCs of 0.9817 to 0.9834 and narrow confidence intervals.
    • The abstract identifies population growth as a key driver of future flood risk.
  • DeepDiscover autonomously infers bucket-type hydrological models

    What the study found

    The study found that DeepDiscover can autonomously discover bucket-type conceptual hydrological models from data. The authors also report that the framework’s learned processes and states are consistent with EXP-HYDRO, a conceptual hydrological model.

    Why the authors say this matters

    The authors conclude that this work is a step toward reducing dependence on expert-defined model formulations. The study suggests that a physics-embedded machine learning framework can support data-driven process discovery in hydrology.

    What the researchers tested

    The researchers developed DeepDiscover, a modular neural architecture whose elementary units are intended to represent reservoirs in bucket-type conceptual hydrological models. They evaluated it on the CAMELS-US dataset in streamflow prediction using three experiments: benchmark comparison, recovery of EXP-HYDRO-like internal dynamics, and perturbation tests.

    What worked and what didn't

    The DeepDiscover-based model, called DD-PeML, outperformed EXP-HYDRO, EXP-PeML, a 1D-CNN, and an LSTM on the test set, with median NSE of 0.68 and median KGE of 0.70. When trained to mirror EXP-HYDRO, the inferred processes and states closely matched EXP-HYDRO, with median R2 of about 70% for processes and 80% for states, and perturbation experiments showed physically coherent responses to precipitation and temperature changes.

    What to keep in mind

    The abstract describes this as a proof of concept, so the findings are presented within that scope. Limitations beyond the use of CAMELS-US and the stated experiments are not described in the available summary.

    • DeepDiscover autonomously infers bucket-type conceptual hydrological models from data.
    • DD-PeML outperformed EXP-HYDRO, EXP-PeML, a 1D-CNN, and an LSTM on the CAMELS-US test set.
    • The model achieved median test NSE of 0.68 and median KGE of 0.70.
    • Inferred processes and states closely matched EXP-HYDRO when trained to mirror it.
    • Perturbation experiments produced physically coherent responses to precipitation and temperature changes.
  • Earth observation data may improve flood forecasting

    What the study found

    The study finds that Earth Observation (EO) data, meaning satellite and other remote-sensing measurements, can help improve river flood monitoring and forecasting. It focuses on using EO data to provide global-scale observations of key hydrological variables such as precipitation, soil moisture, river discharge, water levels, and flood extent.

    Why the authors say this matters

    The authors suggest that EO-based flood forecasting could help bridge observational gaps, particularly in vulnerable regions. They also conclude that recent advances in remote sensing, data assimilation, and AI may increase the impact of satellite data in operational flood forecasting systems.

    What the researchers tested

    This is a review and discussion paper. The authors examined the capability of EO data to enhance flood forecasting systems by looking at accuracy, lead time, and reliability, and by discussing key challenges that affect their use.

    What worked and what didn't

    The paper reports that EO data offer a viable way to support flood forecasting when ground-based hydrological networks and numerical weather models are limited by sparse data. It also notes challenges, including data latency, trade-offs between spatial and temporal resolution, and constraints in model assimilation.

    What to keep in mind

    The abstract does not report new experiments or a single tested system; it summarizes existing literature and current capabilities. It also does not provide detailed quantitative results, so the available summary is limited to broad assessments and stated challenges.

    • EO data can support flood monitoring and forecasting when ground-based data are sparse.
    • The paper discusses EO measurements of precipitation, soil moisture, river discharge, water levels, and flood extent.
    • The authors highlight data latency, resolution trade-offs, and assimilation constraints as major challenges.
    • Recent advances in remote sensing, data assimilation, and AI are presented as important for future flood forecasting systems.
    • The paper is a review and discussion of existing work, not a new forecasting experiment.
  • SWAT review links land use change and climate impacts in agricultural watersheds

    What the study found

    The review found that SWAT (Soil and Water Assessment Tool) studies in developing-country agricultural watersheds often report satisfactory to very good model performance. It also found that medium-sized basins are the most commonly studied, and that land use and land cover change is strongly linked with hydrological change.

    Why the authors say this matters

    The authors conclude that the review offers insights for effective water resource management in agricultural watersheds. They also say it helps link basin scale, climate regime, model reliability, and best management practice effectiveness.

    What the researchers tested

    The researchers compiled 143 studies published between 2017 and 2025 using the PRISMA research protocol and analyzed the data collection using the PICO method. They examined SWAT model performance, watershed characteristics, land use land cover change, climate change, and best management practices in developing regions.

    What worked and what didn't

    Medium-sized basins, defined as 10,001–100,000 km², accounted for about 33% of the studies. Most studies reported R² and NSE values above 0.5, which the abstract describes as satisfactory to very good results; it also reports a strong correlation between land use and hydrological changes with R² = 0.923. The review identifies best management practice combinations in series, including structural and management practices, as important for watershed protection and sustainable agricultural practice.

    What to keep in mind

    The abstract says the paper provided narrative-driven regional analyses with limited statistical integration. It also notes that future research should focus on data collection and calibration methods for SWAT modeling, climate change projections, extreme event scenarios, and long-term analysis linked to sustainable agriculture planning.

    • 143 studies from 2017–2025 were reviewed using PRISMA and PICO.
    • Medium-sized basins (10,001–100,000 km²) made up about 33% of SWAT applications.
    • Most studies reported R² and NSE values greater than 0.5.
    • The abstract reports a strong land use–hydrology relationship with R² = 0.923.
    • The review highlights combined structural and management best management practices.
  • Human water management strongly alters streamflow in parts of the Mississippi Basin

    What the study found

    The study found that reservoir operation and irrigation together substantially alter streamflow in the Missouri and Arkansas-White-Red regions of the Mississippi River Basin. It also identified data and modeling gaps in several hydrologic regions.

    Why the authors say this matters

    The authors say this matters because data constraints can force simplifying assumptions in hydrological models, which may introduce unintended biases and obscure human influences on streamflow. The study suggests that more realistic, computationally efficient representations could improve large-scale streamflow simulation.

    What the researchers tested

    The researchers compiled a data inventory of human interventions in hydrological systems for the Contiguous United States, including reservoir operations, inter-basin transfers, and water supplies for irrigation, municipal use, industry, and thermoelectric cooling. They then developed a modeling framework that uses the Budyko hypothesis, a water-balance concept for relating climate and runoff, to diagnose which management activities most strongly modify streamflow regimes and where those impacts occur.

    What worked and what didn't

    Applied to the Mississippi River Basin, the framework showed that reservoir operation and irrigation substantially altered flows in the Missouri and Arkansas-White-Red regions. It also pointed to missing canal-diversion records on the Platte River in the Missouri region, insufficient tile-drain representations in the Ohio region, and surface-groundwater interaction gaps in the Arkansas-White-Red region.

    What to keep in mind

    The abstract does not provide detailed performance metrics for the framework or quantify the size of all identified data gaps. The results described are specific to the Mississippi River Basin, although the inventory was compiled for the Contiguous United States.

    • Reservoir operation and irrigation substantially altered streamflow in the Missouri and Arkansas-White-Red regions.
    • The study compiled a U.S. data inventory of human interventions in hydrological systems.
    • The framework used the Budyko hypothesis to diagnose management effects on streamflow regimes.
    • Missing canal-diversion records, tile-drain representations, and surface-groundwater interactions were identified as gaps.
    • The authors note that simplifying assumptions in models may bias streamflow simulations.
  • Mega-floods increased nutrient loads in the southern Murray-Darling Basin

    What the study found

    The study found that the 2022 to 2023 mega-flood, described as the largest since 1956, contributed disproportionately to water flow and nutrient export in the southern Murray-Darling Basin. It was associated with higher nutrient peaks and concentrations downstream, and nutrient release that was delayed on the falling limb of the flood wave.

    Why the authors say this matters

    The authors conclude that more frequent climate-driven mega-floods may lead to proportionally larger nutrient loads and longer periods of water-quality degradation. They also suggest that the amount of nutrient export depends on antecedent catchment conditions and on how much nutrient is available to be transported.

    What the researchers tested

    The researchers examined the dynamics of total nitrogen, total phosphorus, and dissolved organic carbon in six major flow events from 2011 to 2014, including the 2022 to 2023 mega-flood. They used statistical and hysteresis analyses at three study sites spanning upper to lower regions of the southern Murray-Darling Basin.

    What worked and what didn't

    The mega-flood accounted for over 30% of total flow, about 18% of total nitrogen yield, and about 20% of total phosphorus yield during the full study period. Downstream sites showed higher nutrient peaks and concentrations, with distinct counter-clockwise hysteresis, while the upstream headwater site showed weak clockwise hysteresis.

    What to keep in mind

    The abstract does not provide detailed limits beyond noting that nutrient export can vary substantially between flood events. It also indicates that the magnitude of export depends on catchment conditions and nutrient stores available before each flood.

    • The 2022 to 2023 mega-flood was the largest since 1956 in the southern Murray-Darling Basin.
    • It contributed over 30% of total flow in the study period.
    • It accounted for about 18% of total nitrogen yield and about 20% of total phosphorus yield.
    • Downstream sites had higher nutrient peaks and concentrations than the upstream site.
    • Counter-clockwise hysteresis suggested delayed nutrient release from floodplains.