Author: editor@focalinterest.com

  • Multimodal imaging supports more precise orthodontic care

    Multimodal imaging supports more precise orthodontic care

    What the study found

    The review concludes that multimodal data fusion technology has notable clinical value in orthodontics. It says this approach can support precise orthodontic treatment and improve collaboration across oral specialties.

    Why the authors say this matters

    The authors say the study suggests multimodal data fusion can overcome the limits of single-modal data, such as limited spatial resolution, poor tissue specificity, and incomplete spatiotemporal information. They also conclude that standardized data platforms may help orthodontists, oral surgeons, prosthodontists, and other specialists work together more smoothly.

    What the researchers tested

    The authors reviewed contemporary clinical literature from PubMed and Web of Science on multimodal data fusion technology in orthodontics. They aimed to describe its applications, progress, and future development directions.

    What worked and what didn't

    The review identified eight commonly used types of modal data in orthodontics, each with distinct characteristics. It reports that multimodal data fusion has been widely applied in orthodontic diagnosis and treatment, has made progress in multidisciplinary care, and can help build models with multidimensional biomechanical parameters for dynamic treatment monitoring and outcome evaluation.

    What to keep in mind

    This is a review of published clinical literature, not a new clinical trial. The abstract notes that future work should improve fusion accuracy and integrate more types of dynamic data, but it does not provide detailed limitations beyond that.

    • The review says multimodal data fusion has notable clinical value in orthodontics.
    • It identifies eight commonly used types of modal data in orthodontic practice.
    • The authors report that multimodal fusion has been widely applied in diagnosis and treatment.
    • The study says the approach supports multidisciplinary care involving orthodontics, oral surgery, and prosthodontics.
    • The abstract calls for better fusion accuracy and more dynamic data in future work.

  • Pulmonary rehabilitation plus vitamin D improved asthma lung function

    What the study found

    The study found that pulmonary rehabilitation and vitamin D supplementation each improved lung function in patients with mild to moderate asthma, and that using them together led to better results than either alone. The abstract also reports that the combined approach was safe and feasible.

    Why the authors say this matters

    The authors conclude that adding vitamin D supplementation to structured pulmonary rehabilitation may offer a safe, feasible, and potentially synergistic strategy for optimizing asthma management. They also state that this approach could improve treatment outcomes.

    What the researchers tested

    The researchers evaluated the combined effect of pulmonary rehabilitation and vitamin D supplementation on pulmonary function tests in asthma patients. They measured forced vital capacity, a lung function measure, and serum 25(OH)D levels before and after the intervention, then analyzed within-group and between-group differences using paired t-tests and ANOVA with Tukey post-hoc tests.

    What worked and what didn't

    Forced vital capacity improved significantly in the groups that received pulmonary rehabilitation and/or vitamin D supplementation, while it remained unchanged in Group B. The abstract says compliance was high and no serious adverse events occurred.

    What to keep in mind

    The abstract does not provide details about sample size, treatment duration, or the exact contents of each group beyond the reported comparisons. It also does not describe limitations in the available summary.

    • Pulmonary rehabilitation and vitamin D supplementation each improved lung function in mild to moderate asthma.
    • The combined approach produced superior outcomes compared with either intervention alone.
    • Forced vital capacity increased in the intervention groups but stayed unchanged in Group B.
    • Compliance was high, and no serious adverse events were reported.
    • The authors describe the combined strategy as safe, feasible, and potentially synergistic.
  • Spatial modification improved Lee–Carter mortality model fit

    What the study found

    The study found that a spatial modification of the Lee–Carter model, a common mortality modeling method, can address the problem of age parameters that are not constant over time. The authors report that adding a cluster effect helped with this issue and produced better model fit than the original model.

    Why the authors say this matters

    The authors suggest this matters because mortality rates are often modeled over age and time, and the study indicates that spatial patterns may help explain why the Lee–Carter model's age parameters change over time. They conclude that using spatial analysis may improve mortality modeling.

    What the researchers tested

    The researchers proposed a spatial modification of the Lee–Carter mortality model and used simulation to examine whether cluster effects could explain the nonconstant age-parameter problem. They also applied the approach to mortality data from Japan, France, the United States, and Taiwan, using spatial cluster detection methods such as spatial scan statistics.

    What worked and what didn't

    In computer simulation, the authors found that cluster effects were a possible source of the nonconstant age-parameter problem, and adding the cluster effect could solve it. In the country data they analyzed, the proposed approach showed better fitting results and smaller mean absolute percentage errors than the Lee–Carter model.

    What to keep in mind

    The abstract does not describe detailed limitations or the size of the data sets. It also only states results for the countries analyzed and for the simulation setting described in the abstract.

    • The study proposes a spatial modification of the Lee–Carter mortality model.
    • The authors say cluster effects may explain why Lee–Carter age parameters are not constant over time.
    • Simulation results suggested that adding a cluster effect could solve the nonconstant parameter problem.
    • Applications to Japan, France, the U.S., and Taiwan showed better fit than the original Lee–Carter model.
    • The proposed approach also produced smaller mean absolute percentage errors than the Lee–Carter model.
  • Global green wave centroid shifts north and east

    What the study found

    The study found that the global "green wave" centroid, meaning the seasonal movement of vegetation across Earth, shifts northward during both boreal and austral summer. It also found that the eastward shift is accelerating, while the overall trajectory amplitude is decreasing.

    Why the authors say this matters

    The authors conclude that tracking the green wave's centroid reveals how changing land dynamics across regions affect the global functioning of Earth's terrestrial biosphere. They present this as a way to better quantify global phenology, meaning seasonal timing in vegetation.

    What the researchers tested

    The researchers proposed a concept to quantify global phenology by tracking the green wave's centroid using satellite data and Earth system model data. They used this trajectory to summarize global phenological dynamics and directional trends.

    What worked and what didn't

    The centroid approach identified northward movement during both summer periods, with the austral summer shift consistently larger than the boreal summer shift across datasets. It also detected an accelerating eastward shift and a decreasing trajectory amplitude, which the abstract says is projected to intensify throughout this century.

    What to keep in mind

    The abstract does not describe detailed limitations beyond noting that a unified metric had been lacking. It also does not provide numerical values in the summary provided here.

    • The global green wave centroid shifts northward in both boreal and austral summer.
    • The austral summer northward shift is consistently larger than the boreal summer shift across datasets.
    • The green wave trajectory amplitude is decreasing and is projected to intensify this century.
    • An accelerating eastward shift was detected and described as previously unreported.
    • The approach uses satellite and Earth system model data to track global phenology.
  • Pseudoacacia honey quality varied by country of origin

    What the study found

    The study found that unifloral pseudoacacia honey can differ in antioxidant capacity, proline content, and phenolic content depending on where it comes from. The authors report that these differences were linked with geographical origin, polyphenol content, and pollen profile.

    Why the authors say this matters

    The authors conclude that comparing honey from different locations can help describe quality differences in pseudoacacia honey. They suggest that botanical and chemical measures together are useful for characterizing unifloral honey.

    What the researchers tested

    The researchers compared pseudoacacia honey samples from Hungary and Slovakia. They verified botanical origin using melissopalynological analysis, which examines pollen in honey, and measured color intensity, antioxidant activity, total polyphenols, flavonoids, phenolic acids, proline, electrical conductivity, refractive index, and optical rotation.

    What worked and what didn't

    Antioxidant activity was assessed with three spectrophotometric methods: DPPH, ABTS, and FRAP. The study reports that antioxidant capacity, proline, and phenolic content varied among samples, while color intensity and other physicochemical parameters were also determined for comparison.

    What to keep in mind

    The abstract does not describe sample size, detailed numerical results, or statistical testing. It also does not state any broader health or commercial implications beyond the observed variation among honey samples.

    • Pseudoacacia honey samples from Hungary and Slovakia were compared.
    • Botanical origin was checked with melissopalynological analysis of pollen in honey.
    • Antioxidant activity was measured using DPPH, ABTS, and FRAP methods.
    • The study found variation in antioxidant capacity, proline, and phenolic content.
    • Differences were associated with geographical origin, polyphenol content, and pollen profile.
  • Stock splits and reverse splits affected returns in Indonesia

    What the study found

    The study found that stock splits were generally associated with positive stock returns in the Indonesia Stock Exchange during 2022-2023, while reverse stock splits were associated with negative returns. In the abstract, these patterns are described through changes in cumulative abnormal return, or CAR, which compares actual returns with expected returns.

    Why the authors say this matters

    The authors conclude that stock splits are viewed as positive signals about a company’s future performance, while reverse stock splits are often interpreted as signs of possible financial or operational problems. The study also says this may help managers, investors, and regulators make more informed decisions in dynamic capital markets such as Indonesia.

    What the researchers tested

    The researchers examined the impact of stock splits and reverse stock splits on stock returns around their effective dates in the Indonesia Stock Exchange. They used an event study method and a cumulative abnormal return, or CAR, approach over a 10-day window before and after the corporate action.

    What worked and what didn't

    For stock splits, CAR increased significantly before the effective date, which the abstract describes as a favorable investor reaction. For reverse stock splits, CAR declined sharply on and after the effective date, indicating a negative effect on stock returns.

    What to keep in mind

    The abstract limits the study to the Indonesia Stock Exchange and the 2022-2023 period. It does not provide additional limitations beyond this scope in the available summary.

    • Stock splits were generally associated with positive stock returns in the Indonesia Stock Exchange.
    • Reverse stock splits were associated with negative stock returns.
    • CAR, or cumulative abnormal return, was used to compare actual and expected returns.
    • The study used a 10-day window before and after each corporate action.
    • The authors say stock splits may signal better future performance, while reverse splits may signal problems.
  • Climate warming and urban context shape European butterfly declines

    Climate warming and urban context shape European butterfly declines

    What the study found

    The study found that climate warming and aridification were consistently linked to butterfly population declines in both urban and rural settings. The authors also report that urban context can strengthen the negative effects of climate change on these populations.

    Why the authors say this matters

    The authors conclude that butterfly population change is shaped by a complex interplay of climate change, urban context, and species traits. They suggest that urbanisation generally amplifies the negative impact of climate change on insect population trends.

    What the researchers tested

    The researchers analysed long-term monitoring data from more than 8,400 populations of 145 butterfly species across 869 sites in 12 European countries. They modelled population trends against temperature, precipitation, aridity, urbanisation, urban versus rural context, and species traits including trophic specialisation, body size, reproductive rate, and thermal adaptation.

    What worked and what didn't

    Climate warming and aridification were consistently associated with declines in butterfly populations in both rural and urban contexts. Urbanisation by itself did not predict trends, but the urban-rural context strongly changed how species responded to warming; species with colder thermal niches and lower reproductive rates were most vulnerable. Under aridification, trophic specialists declined more in urban areas, while generalists declined more in rural sites.

    What to keep in mind

    The abstract does not describe specific limitations of the study. It also notes that precipitation effects varied by location and species, so those results were not consistent across the full data set.

    • Climate warming and aridification were linked to butterfly population declines across Europe.
    • Urbanisation alone did not predict butterfly population trends.
    • Urban context strengthened the negative impact of warming on butterfly populations.
    • Species with colder thermal niches and lower reproductive rates were most vulnerable to warming.
    • Precipitation effects varied by location and species.
    • Under aridification, trophic specialists declined more in urban areas, while generalists declined more in rural sites.
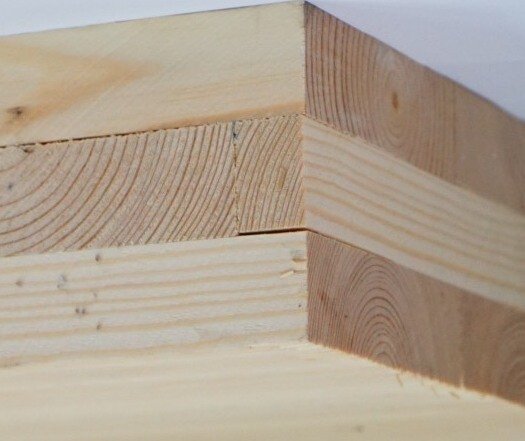
  • Beam integration reduced low-frequency impact noise in CLT floors

    Beam integration reduced low-frequency impact noise in CLT floors

    What the study found

    The study found that integrating beams into cross-laminated-timber (CLT) floors reduced low-frequency impact noise, and that the event maximum level, or LAFmax, was strongly associated with perceived loudness. The authors report that this relationship held for both magnitude estimation and paired-comparison listening tests.

    Why the authors say this matters

    The authors conclude that beam integration is an effective structural lever for sub-100 Hz impact noise. They also say that LAFmax, assessed on simulation or rubber-ball tests, provides a perceptually grounded design metric that complements conventional ratings.

    What the researchers tested

    The researchers coupled a validated plate-beam finite-element model of a two-story CLT test building with a rectangular room-acoustic model. They generated 12 auralized stimuli from three slab thicknesses (150, 210, and 270 mm), with and without mid-span and quarter-span beams, using jump-type and run-type force inputs, and then played them to 20 normal-hearing adults in a semi-anechoic room.

    What worked and what didn't

    Beam integration lowered LAFmax by 1.9 dB, 1.3 dB, and 5.9 dB for the 150, 210, and 270 mm slabs, respectively, with a mean reduction of 3.1 dB. Thicker slabs were consistently quieter than thinner ones, and the listening results showed strong correlations between perceived loudness and LAFmax (r = 0.88 for magnitude estimation and r = 0.85 for paired comparison).

    What to keep in mind

    The abstract does not describe limitations beyond the specific simulation-and-listening setup used here. The findings are based on one modeled two-story CLT test building, 20 normal-hearing adults, and the tested slab and beam configurations.

    • Low-frequency floor-impact noise was identified as the main acoustic weakness of CLT construction.
    • Beam integration reduced LAFmax for all three slab thicknesses tested.
    • The largest LAFmax reduction was reported for the 270 mm slab.
    • Perceived loudness was strongly correlated with LAFmax in both listening methods.
    • The authors say LAFmax can serve as a perceptually grounded design metric.
  • Cable length affects vibration-related joint degradation in ultrasonically welded connections

    What the study found

    The study found that cable length strongly influenced whether ultrasonically welded cable-arrester joints remained intact or degraded. Unsynchronized vibration transmission, described as relative phase shifts, was identified as the primary cause of joint failure.

    Why the authors say this matters

    The authors say this matters because ultrasonic metal welding is used for lightweight electrical connections in electric vehicles, and vibration from one weld can interfere with previously welded joints. The study suggests that understanding vibration propagation is important for process reliability.

    What the researchers tested

    The researchers studied stranded aluminum wires joined to copper terminals with linear ultrasonic metal welding. They tested cable lengths from 150 to 1000 mm using laser vibrometry, high-speed videography, and tensile shear testing, and they also built and validated a scaled finite element model in ANSYS Workbench.

    What worked and what didn't

    Mechanical testing showed robust joints at 300 mm, non-weldable behavior at 225 mm, and isolated failures at 150 mm and 375 mm. Longer cables showed no signs of joint degradation. Laser vibrometry showed decreasing vibration amplitudes with increasing length because of damping, while critical lengths showed pronounced amplitude and phase shifts; the simulations reproduced these effects and identified weld-zone stresses of about 130 MPa at critical lengths.

    What to keep in mind

    The abstract describes results for EN AW-1370 aluminum stranded wires joined to CW004A copper terminals under linear ultrasonic metal welding, so the findings are specific to this setup. The abstract does not describe additional limitations beyond the tested cable lengths and materials.

    • Cable length strongly affected joint integrity in ultrasonically welded cable-arrester connections.
    • Relative phase shifts in vibration transmission were identified as the main cause of joint failure.
    • Robust joints were reported at 300 mm, while 225 mm showed non-weldable behavior.
    • 150 mm and 375 mm showed isolated failures, and longer cables showed no joint degradation.
    • A finite element model reproduced the measured vibration effects and estimated weld-zone stresses of about 130 MPa at critical lengths.
  • Deep learning mapped craniofacial growth patterns across ages and sex

    Deep learning mapped craniofacial growth patterns across ages and sex

    What the study found

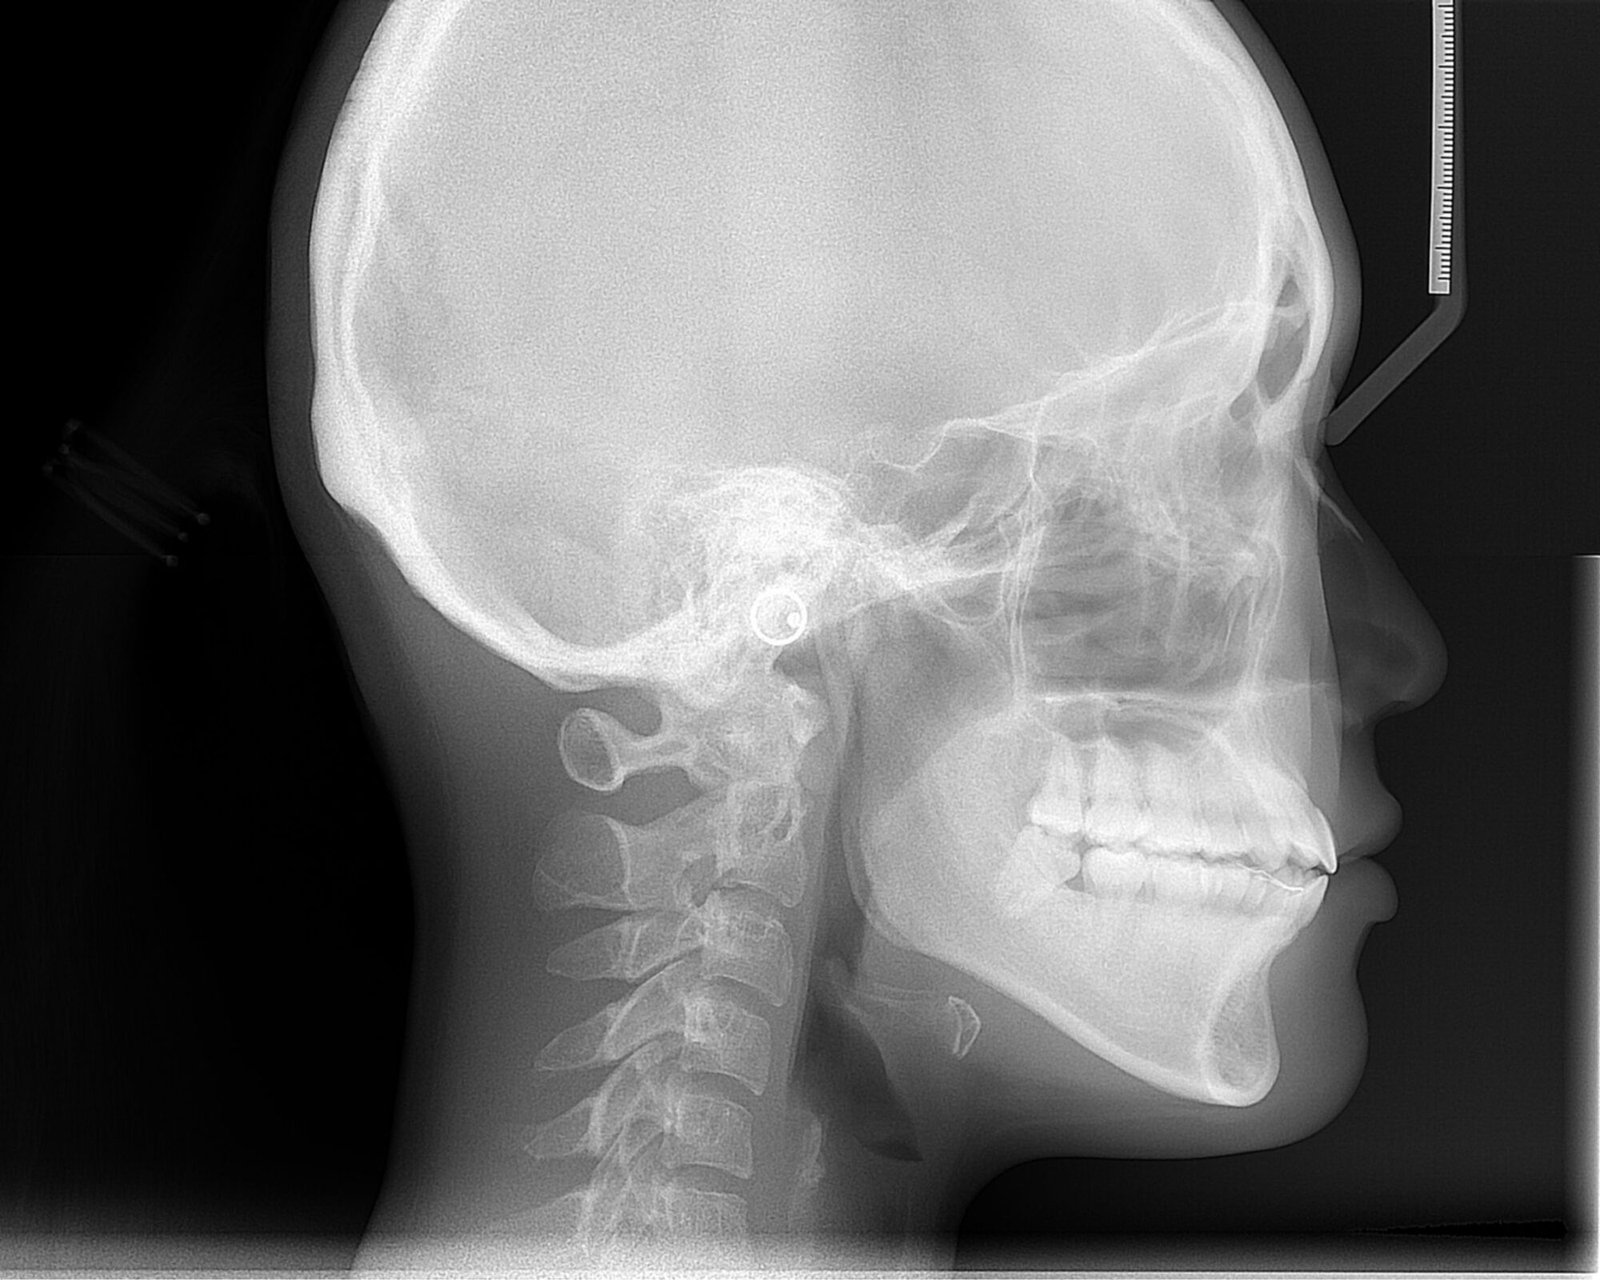
    The study found that an end-to-end AI framework could identify and quantify age-related and sex-related patterns in craniofacial growth from lateral cephalometric radiographs, which are side-view X-ray images of the head. The authors report that the model visualized changing growth patterns across development and measured sex differences in craniofacial regions.

    Why the authors say this matters

    The authors conclude that the findings provide objective quantitative references for assessing developmental stages and for guiding the timing of interventions targeting specific craniofacial regions. They also say the results validate established developmental theories and offer new insights into coordinated craniofacial bone growth and sex-specific radiological characteristics.

    What the researchers tested

    The researchers developed an end-to-end deep learning framework using lateral cephalometric radiographs from 41,625 people aged 4 to 18 years. The model was designed to learn directly from the images without manual annotations, and Grad-CAM, or gradient-weighted class activation mapping, was used to create population-averaged saliency maps showing age-related and sex-related patterns. They also introduced two measures, the Age-related Saliency Index (ASI) and the Sex-related Saliency Index (SSI), to quantify the importance of developmental and sex-related features in craniofacial regions.

    What worked and what didn't

    Age-related saliency maps showed a shift in attention from external contours to internal bone details, and the ASI was used to prioritize these regions quantitatively. The SSI showed that sex differences were broadly distributed across cranial bones at earlier stages and became concentrated in the mandibular region by adulthood. The abstract does not describe failed analyses or negative results.

    What to keep in mind

    The summary provided does not describe specific limitations or external validation details. The findings are based on lateral cephalometric radiographs from ages 4 to 18, so the stated scope is limited to that developmental range and imaging type.

    • An AI framework was trained on 41,625 lateral cephalometric radiographs from people aged 4 to 18 years.
    • The model worked without manual annotations during training.
    • Grad-CAM was used to show age-related and sex-related saliency patterns across craniofacial regions.
    • Age-related attention shifted from external contours to internal bone details during development.
    • Sex differences were widely distributed in early stages and became concentrated in the mandibular region by adulthood.