Blog

  • Nine-month all-oral tuberculosis regimens showed durable three-year outcomes

    What the study found

    The study found that nine-month, all-oral regimens for rifampicin-resistant tuberculosis were associated with durable outcomes three years after treatment ended. Persistent linezolid-related neuropathic or visual symptoms were also still seen in a substantial share of participants.

    Why the authors say this matters

    The authors conclude that the findings support durable three-year outcomes for these regimens. They also say the persistent neuropathy warrants proactive mitigation, including reducing cumulative linezolid exposure or using linezolid-sparing alternatives when feasible.

    What the researchers tested

    This was a multicentre, prospective cohort study in China called MDR-Chin. It included 124 adults with culture-confirmed multidrug-resistant or rifampicin-resistant tuberculosis, or pre-extensively drug-resistant tuberculosis, who received one of four nine-month all-oral regimens containing linezolid at 600 mg/day. The researchers assessed efficacy 36 months after treatment completion and tracked persistent linezolid-related neuropathic or visual symptoms lasting at least 24 months.

    What worked and what didn't

    At 36 months after treatment completion, 111 of 124 participants, or 89.5%, had a favourable outcome, defined as no failure, relapse, or death. There were no significant differences in favourable outcomes among the four regimens. Persistent linezolid-related neuropathic or visual symptoms were reported by 28 of 124 participants, or 22.6%, and foot numbness was the most frequent symptom, reported by 22 participants.

    What to keep in mind

    The study was non-randomised and observational, so it does not establish causal comparisons between regimens. The abstract does not provide further detail on the causes of symptoms beyond linezolid-related neuropathic or visual effects, and it does not describe additional limitations.

    • 111 of 124 participants had a favourable outcome 36 months after treatment ended.
    • No significant differences in favourable outcomes were seen among the four regimens.
    • 28 of 124 participants reported persistent linezolid-related neuropathic or visual symptoms.
    • Foot numbness was the most common persistent symptom.
    • The authors suggest reducing cumulative linezolid exposure or using linezolid-sparing alternatives when feasible.

  • Liquidity shocks spill over to related corporate bond peers

    What the study found

    The study found that liquidity shocks in downgraded corporate bonds can spill over to other bonds in the market. The spillovers were seen especially in peer bonds issued by firms with high fundamental volatility, a small number of economically related peers, and peers with a higher degree of learning, meaning a stronger correlation between trading volume and return volatility.

    Why the authors say this matters

    The authors conclude that the evidence supports the cross-asset learning hypothesis. They suggest that liquidity contagion from one asset to others arises through information learning across assets.

    What the researchers tested

    The researcher examined liquidity spillover in the corporate bond market. The study used regulation-induced selling pressure that followed rating downgrades from investment grade to high yield as the setting for the analysis.

    What worked and what didn't

    The empirical evidence showed spillovers from downgraded bonds to certain peer bonds. The study reports stronger spillovers for peers with high fundamental volatility, for a small number of economically related peers, and for peers with higher learning as indicated by the correlation between trading volume and return volatility.

    What to keep in mind

    The abstract does not describe specific limitations. The summary is limited to the corporate bond market setting and to spillovers associated with rating downgrades from investment grade to high yield.

    • Liquidity shocks in downgraded corporate bonds spilled over to some peer bonds.
    • Spillovers were stronger for peers issued by firms with high fundamental volatility.
    • Spillovers also appeared among a small number of economically related peer bonds.
    • Peer bonds with a higher degree of learning showed stronger spillover patterns.
    • The findings support the cross-asset learning hypothesis.
  • Pediatric primary care training improved mental health readiness

    What the study found

    The study found that a continuing medical education program for primary care clinicians was linked to better knowledge, self-efficacy, and behavioral intentions for pediatric mental health care. Gains were sustained at 6 months for primary care-common disorders such as attention-deficit hyperactivity disorder, depression, anxiety, and suicidality.

    Why the authors say this matters

    The authors conclude that this model produced durable improvements in primary care clinicians' readiness to deliver pediatric mental health care. They also suggest that the measurement tool may provide a practical, domain-specific way to evaluate multidisorder pediatric mental health training initiatives in primary care.

    What the researchers tested

    The researchers evaluated a theory-based measurement tool for assessing primary care clinicians' knowledge, self-efficacy, and behavioral intentions across key pediatric mental health conditions. They studied the Patient-Centered Mental Health in Pediatric Primary Care mini-fellowship, which included a 3-day interactive workshop and 12 follow-up coaching calls, using a 68-item assessment at baseline, after the workshop, and at 6 months.

    What worked and what didn't

    Principal-components analysis identified 10 stable domains aligned with clinical priorities and separated primary care-common disorders from specialty-level disorders such as bipolar disorder, severe aggression, and conduct disorders. All domains showed strong internal consistency, and mixed-effects regression models found significant postworkshop improvements in knowledge, self-efficacy, and behavioral intentions, with sustained gains at 6 months for primary care-common disorders. Improvements in knowledge of and comfort with specialty-level disorders predicted stronger behavioral intentions across both common and specialty conditions.

    What to keep in mind

    The abstract does not describe detailed clinical outcomes beyond knowledge, self-efficacy, and behavioral intentions. Of the 898 clinicians who completed baseline assessment, 416 completed the 6-month follow-up; the abstract says there were no baseline differences between those who completed follow-up and those who did not. It also notes that clinicians trained after the onset of the COVID-19 pandemic had slightly larger and more persistent improvements.

    • The training program was associated with improved knowledge, self-efficacy, and behavioral intentions in primary care clinicians.
    • Sustained 6-month gains were reported for primary care-common disorders, including ADHD, depression, anxiety, and suicidality.
    • A 68-item tool identified 10 stable domains and showed strong internal consistency.
    • Knowledge of and comfort with specialty-level disorders predicted stronger behavioral intentions.
    • No baseline differences were found between clinicians who did and did not complete the 6-month follow-up.
  • Graphing instruction benefited K–12 STEM learning

    What the study found

    The review found that graphing instruction in K–12 STEM education was generally beneficial for student learning. It was associated with better graph construction and also improved graph interpretation skills.

    Why the authors say this matters

    The authors conclude that graphing is an important student activity in STEM education because it connects understanding graphs with creating them. The review suggests that students could benefit from an in-depth analysis of authentic data during graphing.

    What the researchers tested

    The researchers conducted a systematic review of empirical studies on graphing, meaning the construction of convention-based graphical representations of numerical data. They searched SCOPUS, ERIC, and PsychInfo and included 54 peer-reviewed empirical studies on graphing in K–12 STEM education.

    What worked and what didn't

    Graphing instruction seemed to improve students' graph construction skills. It also appeared to improve graph interpretation skills, but students still experienced various difficulties during graph construction as well as during interpretation and use of data.

    What to keep in mind

    The abstract does not describe detailed limitations beyond the review's inclusion criteria and database search. The findings are limited to the 54 peer-reviewed empirical studies identified in K–12 STEM education.

    • The review covered 54 peer-reviewed empirical studies on graphing in K–12 STEM education.
    • Graphing instruction seemed to benefit student learning.
    • The reported benefits included better graph construction and graph interpretation skills.
    • Students experienced difficulties both in making graphs and in working with data.
    • The authors suggest that in-depth analysis of authentic data may help students during graphing.
  • Children’s taking depends on relative status and gender

    Children’s taking depends on relative status and gender

    What the study found

    The study found that children’s resource taking changed with relative status, which means whether they were in a winning or losing position compared with another child. When status was low, children took more than half the tokens; when status was high, they did not differ from an equal split. Gender differences appeared only when status was equal.

    Why the authors say this matters

    The authors conclude that the findings indicate early sensitivity to social status and help specify when gender differences in taking emerge. The study suggests that taking is calibrated to socially instantiated relative status rather than performance alone.

    What the researchers tested

    The researchers ran two preregistered studies with 4- to 8-year-old children. In Study 1, children competed in a ‘Where’s Waldo?’ task against a pre-recorded peer and were randomly assigned to win or lose, then chose how many tokens to take from either a prior winner or loser. In Study 2, children played against the clock without a peer competitor and were randomly assigned to succeed or fail before taking tokens from peers.

    What worked and what didn't

    In Study 1, low-status children taking from high-status peers took more than half the tokens, while high-status children taking from low-status peers did not differ from an equal split. Under equal status, boys took more than half, whereas girls did not differ from an equal split. In Study 2, children in the non-social context took more than half of their peers’ tokens.

    What to keep in mind

    The summary does not describe additional limitations beyond the study designs themselves. The findings are based on two preregistered studies with children ages 4 to 8, so the abstract does not support claims beyond that age range or beyond the tasks used here.

    • Children with low relative status took more than half the tokens from another child.
    • Children with high relative status did not differ from an equal split.
    • Under equal status, boys took more than half while girls did not.
    • In a non-social context, children took more than half of peers’ tokens.
    • The authors say taking is calibrated to social relative status, not performance alone.
  • Projected land cover changes slightly increase flood discharge

    What the study found

    The study found that projected land cover change in the Cijangkelok Watershed is associated with a small rise in flood discharge. The authors report that the 2035 scenario shows land conversion mainly from dryland to rice fields, built-up areas, and forest plantations.

    Why the authors say this matters

    The findings indicate that land cover change contributes to higher flood potential. The authors conclude that the increase is still at a moderate level because much of the conversion is to rice fields, which they describe as temporary water storage that delays direct runoff.

    What the researchers tested

    The researchers analyzed land cover changes using Curve Number (a runoff-related parameter), Impervious area, and Initial Abstraction (the amount of rainfall absorbed before runoff begins). They used land cover data from 2009 and 2022, modeled a 2035 scenario with QGIS MOLUSCE using an artificial neural network (ANN), and ran HEC-HMS simulations with SCS and Snyder Unit Hydrograph methods.

    What worked and what didn't

    The 2035 land cover prediction had a minimum overall error of 0.0332 and a Kappa coefficient of 0.765, which the authors describe as good reliability. Composite Curve Number increased from 67.9 in 2009 to 68.0 in 2022 and 68.4 in 2035; Impervious area increased from 5.6 to 5.7 and 6.4; and Initial Abstraction decreased from 24.0 to 23.9 and 23.5. Flood discharge rose from 617.2 m³/s to 623.8 m³/s to 641.3 m³/s with the SCS method, and from 621.3 to 621.6 to 630.5 m³/s with the Snyder method. The statistical comparison with frequency-based design flood discharge gave PBIAS values of 0.1–0.2 and NSE of 1.0, which the abstract describes as very good.

    What to keep in mind

    The abstract provides no detailed discussion of study limitations beyond the model-based nature of the work. The reported flood increase is specific to the Cijangkelok Watershed and to the 2009, 2022, and 2035 land cover scenarios described in the study.

    • Projected 2035 land cover change is concentrated in conversions from dryland to rice fields, built-up areas, and forest plantations.
    • Composite Curve Number rose slightly across the study years, while Initial Abstraction decreased.
    • Simulated flood discharge increased under both the SCS and Snyder methods.
    • The 2035 land cover model had an overall error of 0.0332 and a Kappa coefficient of 0.765.
    • The authors state that the flood increase remains at a moderate level because rice fields can temporarily store water.
  • Amazonian caimans show different thermoregulation strategies

    Amazonian caimans show different thermoregulation strategies

    What the study found

    The study found that Paleosuchus palpebrosus is a thermoconformer, meaning its body temperature tends to follow the surrounding environment, while Caiman crocodilus and Melanosuchus niger are active thermoregulators, meaning they regulate body temperature more actively. The authors also report that the two thermoregulating species appear to use the skull's extended blood-vessel network and dorsal osteoderms, the bony plates on the back, to store heat.

    Why the authors say this matters

    The authors suggest there are correlations between the habitats occupied by each species and their thermoregulatory strategies. They also conclude that their observations add to understanding how these Amazonian caimans manage body temperature.

    What the researchers tested

    The researchers investigated body temperature in three captive caiman species from the Amazonian basin: Paleosuchus palpebrosus, Caiman crocodilus, and Melanosuchus niger. They used ingested temperature sensors and thermal imaging to study thermoregulation.

    What worked and what didn't

    The measurements confirmed that P. palpebrosus was a thermoconformer. C. crocodilus and M. niger showed active thermoregulation, and the study provides some data indicating that both species may store heat in the skull and dorsal osteoderms.

    What to keep in mind

    The abstract describes work on three captive species, so the summary is limited to those animals and conditions. It does not provide details on sample size, experimental duration, or broader limitations.

    • Paleosuchus palpebrosus was identified as a thermoconformer.
    • Caiman crocodilus and Melanosuchus niger were identified as active thermoregulators.
    • The two thermoregulating species may store heat in the skull and dorsal osteoderms.
    • The authors suggest thermoregulation may relate to habitat differences among the species.
    • The study examined three captive Amazonian caiman species using temperature sensors and thermal imaging.
  • Sea ice reference data aligned for satellite altimetry comparison

    Sea ice reference data aligned for satellite altimetry comparison

    What the study found

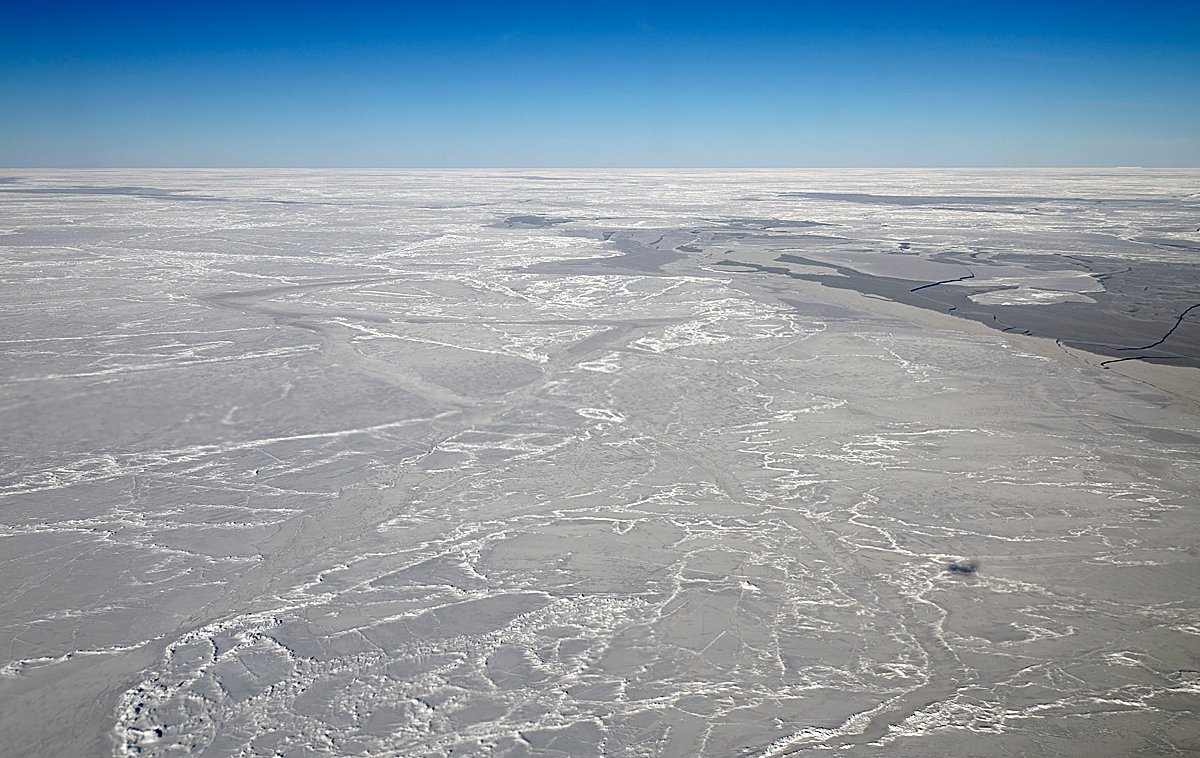
    The study presents a repurposed data package of sea ice reference measurements that is matched to the spatial and temporal scale of satellite altimetry products. It includes measurements of freeboard, thickness, draft, and snow depth from both the Northern Hemisphere and Southern Hemisphere.

    Why the authors say this matters

    The authors say satellite-derived sea ice thickness estimates need quality control against reference measurements, because time series of these estimates are of limited use without validation. The study suggests the new data package can support direct evaluation and intercomparison of satellite altimetry products.

    What the researchers tested

    The researchers introduced the Climate Change Initiative sea ice thickness Round Robin Data Package, a published collection of sea ice reference measurements repurposed for satellite altimetry evaluation. The data were compiled from airborne sensors, autonomous drifting buoys, moored and submarine-mounted upward-looking sonars, and visual observations, and then prepared to match conventional satellite products at 25 km monthly resolution in the Northern Hemisphere and 50 km monthly resolution in the Southern Hemisphere.

    What worked and what didn't

    The paper reports that the package was collocated with satellite-derived sea ice thickness products from CryoSat-2, Envisat, and ERS-1/2 to demonstrate overlap and intercomparison. It also presents the averaging, collocation, and uncertainty methodology, and discusses advantages and limitations, but the abstract does not give numerical performance results.

    What to keep in mind

    The abstract does not provide quantitative validation outcomes or detailed comparisons, so the strength of the evaluation cannot be judged from this summary alone. It also notes that reference measurements are sparse in polar regions and rarely match the time-space averaging of satellite products.

    • The study presents a data package for comparing sea ice reference measurements with satellite altimetry products.
    • The package includes freeboard, thickness, draft, and snow depth measurements from both hemispheres.
    • It was prepared to match satellite product scales: 25 km monthly in the Northern Hemisphere and 50 km monthly in the Southern Hemisphere.
    • The data were collocated with CryoSat-2, Envisat, and ERS-1/2 sea ice thickness products.
    • The abstract does not report numerical validation results.
  • Black Sea naval mines create environmental and legal risks

    Black Sea naval mines create environmental and legal risks

    What the study found

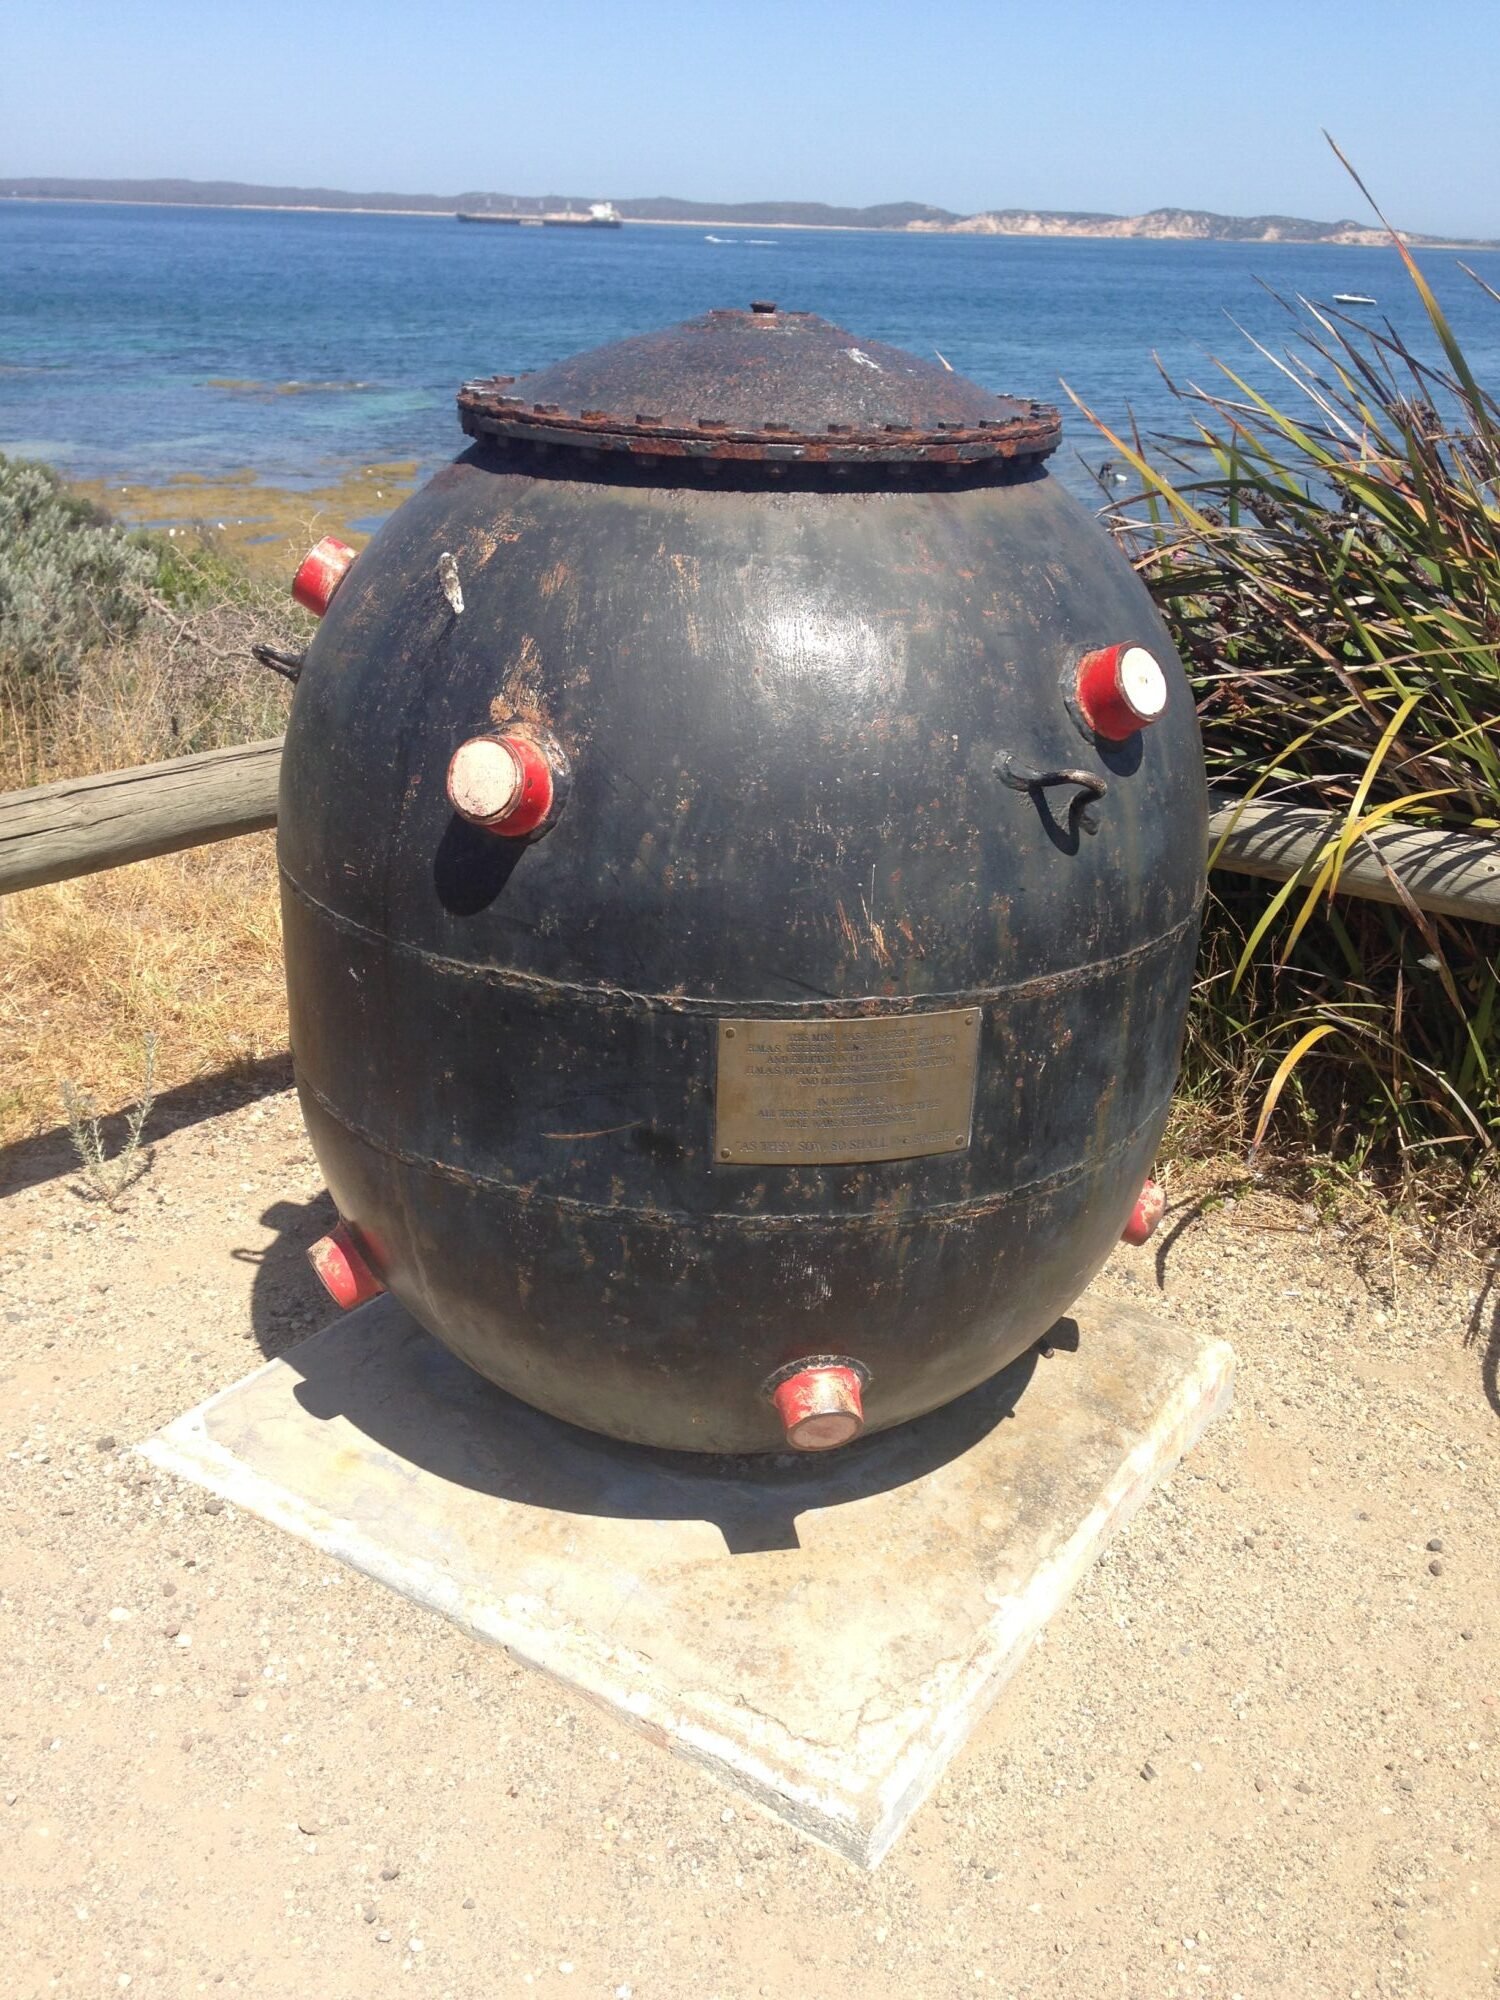
    The article concludes that naval mines in the Black Sea have created significant environmental, transboundary, and legal concerns. It says drifting or uncontrolled mines can threaten marine biodiversity, coastal ecosystems, commercial fisheries, and regional maritime safety.

    Why the authors say this matters

    The authors suggest this matters because the existing legal mechanisms do not sufficiently address the environmental side of naval mine deployment, especially transboundary ecological damage and long-term marine pollution. They also connect the issue to environmental security, marine ecosystem protection, and regional cooperation in the Black Sea.

    What the researchers tested

    The article uses an interdisciplinary approach to examine the ecological effects of mine warfare in the marine environment and reviews relevant legal frameworks, including Hague Convention VIII of 1907, the UN Convention on the Law of the Sea (UNCLOS), the Bucharest Convention, and customary international humanitarian law. It also evaluates documented mine incidents from 2022 to 2024 against principles such as distinction, proportionality, notification, and the obligation to prevent marine pollution.

    What worked and what didn't

    The article reports that drifting mines, which can move with hydrodynamic currents or extreme weather, pose risks to marine biodiversity, coastal ecosystems, commercial fisheries, and maritime safety. It also finds that current legal mechanisms fail to sufficiently address environmental harm from naval mine deployment, while soft law instruments such as the San Remo Manual and IMO Guidelines are discussed as possible ways to improve environmental protection standards.

    What to keep in mind

    The abstract does not describe detailed study limitations or provide quantitative estimates of the environmental effects. The discussion is limited to the Black Sea conflict context and the legal and ecological issues named in the abstract.

    • Naval mines in the Black Sea are described as creating environmental, transboundary, and legal risks.
    • Drifting or uncontrolled mines are said to threaten biodiversity, coastal ecosystems, fisheries, and maritime safety.
    • The article reviews Hague Convention VIII, UNCLOS, the Bucharest Convention, and customary international humanitarian law.
    • Incident records from 2022 to 2024 were assessed against distinction, proportionality, notification, and anti-pollution principles.
    • The authors state that current legal mechanisms do not sufficiently address environmental damage from naval mine deployment.
  • Qianshan villages show moderately low rural resilience

    Qianshan villages show moderately low rural resilience

    What the study found

    The study found that rural resilience in Qianshan City’s villages was generally moderately low and varied substantially from village to village. It also found clear spatial patterns, including a central agglomeration–peripheral dispersion pattern linked to urban proximity.

    Why the authors say this matters

    The authors say the study is important for navigating compounded risks and unbalanced urban–rural development. They conclude that the findings provide a scientific basis for rural resilience building and governance.

    What the researchers tested

    The researchers examined 170 villages in Qianshan City, Anhui Province, China. They built a four-dimensional rural resilience evaluation system covering economic, social, infrastructural, and ecological dimensions, and used the entropy weight method, spatial autocorrelation analysis, and the obstacle degree model.

    What worked and what didn't

    Overall rural comprehensive resilience averaged 0.133, with values ranging from 0.0604 to 0.4805. Economic resilience was generally low, infrastructural resilience varied the most, social resilience was relatively stable spatially, and ecological resilience showed a high-in-the-northwest, low-in-the-southeast pattern. Hotspots of comprehensive, economic, social, and infrastructural resilience were concentrated around central and southern urban areas, while ecological resilience hotspots were separately distributed in ecologically advantageous zones. The main constraints were deficits in public service accessibility and infrastructure conditions.

    What to keep in mind

    The summary does not describe detailed limitations beyond the study’s village-scale focus in one city. The reported obstacle factors were said to be highly consistent across villages with different geomorphic conditions, but no further caveats are given in the abstract.

    • Rural resilience in Qianshan City was assessed as moderately low overall.
    • Village-to-village differences formed a central agglomeration–peripheral dispersion pattern tied to urban proximity.
    • Economic resilience was generally low, while infrastructural resilience showed the greatest variation.
    • Ecological resilience followed a northwest-high, southeast-low spatial pattern.
    • Public service accessibility and infrastructure conditions were the main constraints.